Cost optimization is one of the pillars of the AWS Well-Architected Framework, and it’s a continual process of refinement and improvement over the span of a workload’s lifecycle. It enables building and operating cost-aware systems that minimize costs, maximize return on investment, and achieve business outcomes.
Amazon SageMaker is a fully managed machine learning (ML) service that offers a variety of cost optimization options and capabilities like managed spot training, multi-model endpoints, AWS Inferentia, ML Savings Plans, and many others that help reduce the total cost of ownership (TCO) of ML workloads compared to other cloud-based options, such as self-managed Amazon Elastic Compute Cloud (Amazon EC2) and AWS-managed Amazon Elastic Kubernetes Service (Amazon EKS).
AWS is dedicated to helping you achieve the highest savings by offering extensive service and pricing options. We provide tools for flexible cost management and improved visibility of detailed cost and usage of your workloads.
In 2021, we launched AWS Support Proactive Services as part of the AWS Enterprise Support plan. Since its introduction, we’ve helped hundreds of customers optimize their workloads, set guardrails, and improve the visibility of their ML workloads’ cost and usage.
In this post, we share lessons learned and walk you through the various ways to analyze your SageMaker usage and identify opportunities for cost optimization.
Analyze Amazon SageMaker spend and determine cost optimization opportunities based on usage:
|
Analyze SageMaker cost using AWS Cost Explorer
AWS Cost Explorer provides preconfigured views that display information about your cost trends and give you a head start on understanding your cost history and trends. It allows you to filter and group by values such as AWS service, usage type, cost allocation tags, EC2 instance type, and more. If you use consolidated billing, you can also filter by linked account. In addition, you can set time intervals and granularity, as well as forecast future costs based on your historical cost and usage data.
Let’s start by using Cost Explorer to identify cost optimization opportunities in SageMaker.
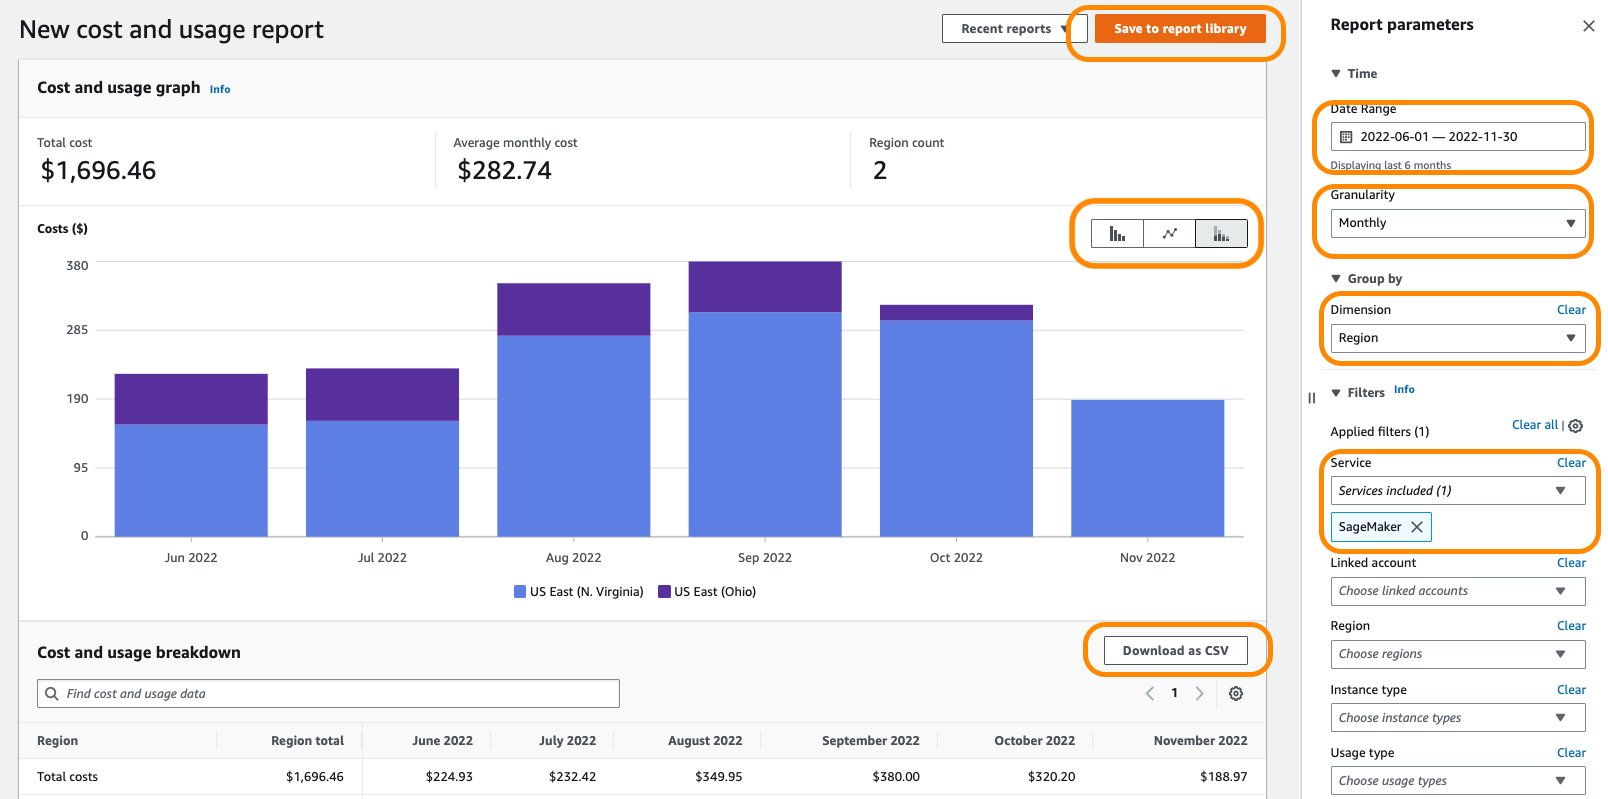
- On the Cost Explorer console, choose SageMaker for Service and choose Apply filters.
- You can set the desired time interval and granularity, as well as the Group by parameter.
- You can display the chart data in bar, line, or stack plot format.
- After you have achieved your desired results with filters and groupings, you can either download your results by choosing Download as CSV or save the report by choosing Save to report library.
The following screenshot shows SageMaker costs per month for the selected date range, grouped by Region.
For general guidance on using Cost Explorer, refer to AWS Cost Explorer’s New Look and Common Use Cases.
Optionally, you can enable AWS Cost and Usage Reports (AWS CUR) to gain insights into the cost and usage data for your accounts. The report contains hourly AWS consumption details. It is stored in Amazon Simple Storage Service (Amazon S3) in the payer account, which consolidates data for all the linked accounts. You can query the report to analyze trends in your usage and take appropriate action to optimize cost. Amazon Athena is a serverless query service you can use to analyze the data from your report in Amazon S3 using standard SQL. For more information and example queries, refer to the AWS CUR Query Library.
The following code is an example of an AWS CUR query to obtain SageMaker costs for the last 3 months of usage:
You can also feed AWS CUR data into Amazon QuickSight, where you can slice and dice it any way you’d like for reporting or visualization purposes. For instructions on ingesting CUR data into QuickSight, see How do I ingest and visualize the AWS Cost and Usage Report (CUR) into Amazon QuickSight.
Analyze cost for SageMaker usage types
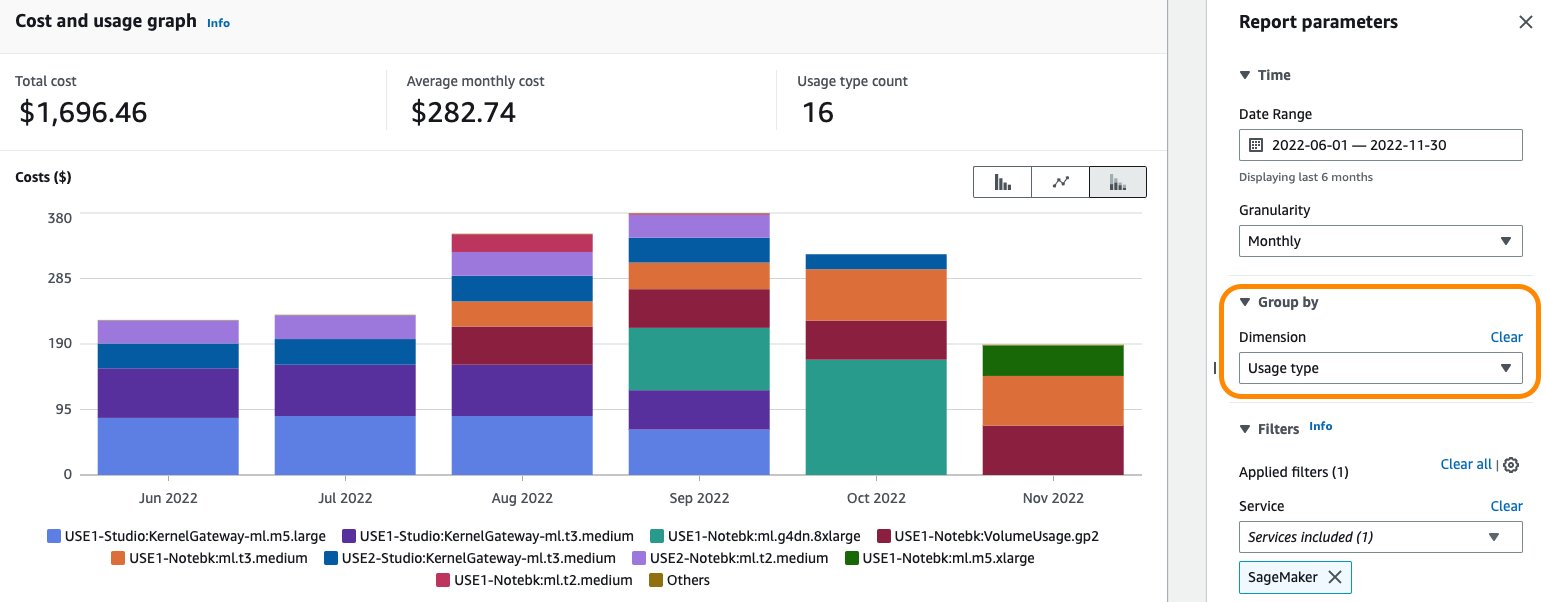
Your monthly SageMaker cost comes from different SageMaker usage types such as notebook instances, hosting, training, and processing, among others. Selecting the SageMaker service filter and grouping by the Usage type dimension in Cost Explorer gives you a general idea of cost distribution based on SageMaker usage type. The usage type is displayed in the format
The following screenshot shows cost distribution grouped by SageMaker usage types when an account has reported usage on notebooks and Amazon SageMaker Studio KernelGateway apps.
General best practices for optimizing SageMaker cost
In this section, we share general recommendations to save on costs while using SageMaker.
Tagging
A tag is a label that you assign to an AWS resource. You can use tags to organize your resources by users, departments, or cost centers, and track your costs on a detailed level. Cost allocation tags can be used for categorizing costs in Cost Explorer or Cost and Usage Reports. For tips and best practices regarding cost allocation for your SageMaker environment and workloads, refer to Set up enterprise-level cost allocation for ML environments and workloads using resource tagging in Amazon SageMaker
AWS Budgets
AWS Budgets gives you visibility into your ML cost on AWS and helps you track your SageMaker cost, including development, training, and hosting. It lets you set custom budgets to track your cost and usage from the simplest to the most complex use cases. AWS Budgets also supports email or Amazon Simple Notification Service (Amazon SNS) notification when actual or forecasted cost and usage exceeds your budget threshold, or when your actual Savings Plans’ utilization or coverage drops below your desired threshold.
AWS Budgets is also integrated with Cost Explorer, so you can easily view and analyze your cost and usage drivers, AWS Chatbot, so you can receive AWS Budget alerts in your designated Slack channel or Amazon Chime room, and AWS Service Catalog, so you can track cost on your approved AWS portfolios and products. You can also set alerts and get a notification when your cost or usage exceeds (or is forecasted to exceed) your budgeted amount. After you create your budget, you can track the progress on the AWS Budgets console. For more information, see Managing your costs with AWS Budgets.
AWS Billing console
The AWS Billing console allows you to easily understand your AWS spending, view and pay invoices, manage billing preferences and tax settings, and access additional cloud financial management services. You can quickly evaluate whether your monthly spend is in line with prior periods, forecast, or budget, and investigate and take corrective actions in a timely manner. You can use the dashboard page of the AWS Billing console to gain a general view of your AWS spending. You can also use it to identify your highest cost service or Region and view trends in your spending over the past few months as well as to see various breakdowns of your AWS usage.
The AWS summary section of the page gives an overview of your AWS costs across all accounts, Regions, service providers, and services, and other KPIs. It also provides a comparison to your total forecasted costs for the current month. The Highest cost section shows your top service, account, or Region by estimated month-to-date (MTD) spend. The Cost trend by top five services section shows the cost trend for your top five services for the most recent three to six closed billing periods.
Planning and forecasting
Forecasting is an essential part of staying on top of your cloud costs and usage, and becomes even more important as your business scales.
AWS has multiple options to help you forecast your costs. The forecasting feature of Cost Explorer gives you the ability to create custom usage forecasts to gain a line of sight into your expected future costs. The built-in ML-powered forecasting of QuickSight allows you to forecast your key business metrics with point-and-click simplicity. It offers a straightforward way to use ML to make predictions on any time series data with minimal setup time and no ML experience required.
You can also use Amazon Forecast, a fully managed service that uses ML to deliver highly accurate forecasts, to generate forecasts for specific AWS services with data collected from AWS CUR. For more information, see Forecasting AWS spend using the AWS Cost and Usage Reports, AWS Glue DataBrew, and Amazon Forecast.
For additional information about cost forecasting options, see Using the right tools for your cloud cost forecasting.
Instance right-sizing
You can optimize SageMaker cost and only pay for what you really need by selecting the right resources. You should right-size the SageMaker compute instances before purchasing a Savings Plan in order to provide a proper commitment and obtain maximum cost savings. SageMaker currently offers ML compute instances on the various instance families. Machine learning is an iterative process with varying compute requirements for different stages of the ML lifecycle, from data preprocessing to model training and model hosting. Identifying the right type of compute instance is challenging, and may lead to over-provisioning of resources and therefore increased cost. The modular architecture of SageMaker allows you to optimize the scalability, performance, and pricing of your ML workloads based on the stage of the ML lifecycle. For more details, refer to the Right-sizing compute resources for Amazon SageMaker notebooks, processing jobs, training, and deployment section of the post Ensure efficient compute resources on Amazon SageMaker.
Amazon SageMaker Savings Plans
Amazon SageMaker Savings Plans is a flexible pricing model for SageMaker. It offers discounted rates in exchange for a commitment to a consistent amount of usage (measured in $/hour) for a 1-year or 3-year term. Savings Plans provide flexibility due to their usage-based model and help reduce your costs by up to 64%. These rates automatically apply to eligible SageMaker ML instance usages including Studio notebooks, SageMaker notebook instances, SageMaker Processing, SageMaker Data Wrangler, SageMaker training, SageMaker real-time inference, and SageMaker batch transform regardless of instance family, size, or Region. This makes it easy for you to maximize savings regardless of how your use cases and consumption evolve over time, and you can save up to 64% compared to the On-Demand price.
For example, you could start with small instances to experiment with different algorithms on a fraction of your dataset. Then, you could move to larger instances to prepare data and train at scale against your full dataset. Finally, you could deploy your models in several Regions to serve low-latency predictions to your users. All the instance size modifications and deployments across new Regions would be covered by the same Savings Plan, without any management effort required on your part.
Every type of SageMaker usage that is eligible for SageMaker Savings Plans has a Savings Plans rate and an On-Demand rate. When you sign up for the SageMaker Savings Plans, you will be charged the Savings Plan rate for your usage up to your commitment. Any usage beyond the commitment will be charged at On-Demand rates. The AWS Cost Management console provides you with recommendations that make it easy to find the right commitment level for a Savings Plan. These recommendations are based on the following:
- Your SageMaker usage in the last 7, 30, or 60 days. You should select the time period that best represents your future usage.
- The term of your plan: 1-year or 3-year.
- Your payment option: No Upfront, Partial Upfront (50% or more), or All Upfront. Some customers prefer (or must use) this last option, because it gives them a clear and predictable view of their SageMaker bill.
The recommendations are based on your historical usage over the selected lookback period and don’t forecast your usage. Be sure to select a lookback period that reflects your future usage. A 3-year term plan provides the highest discount rate; similarly, an All Upfront payment option offers the highest discount rate compared to No Upfront or Partial Upfront payment options. Workloads and usage typically change over time and a consistent, steady-state usage pattern makes a good candidate for a savings plan. If you have a lot of short-lived or one-off workloads, selecting the right commitment for compute usage (measured per hour) could be difficult. It’s recommended to continually purchase small amounts of Savings Plans commitment over time. This ensures that you maintain high levels of coverage to maximize your discounts, and your plans closely match your workload and organization requirements at all times.
To understand Savings Plan recommendations, refer to Decrease Your Machine Learning Costs with Instance Price Reductions and Savings Plans for Amazon SageMaker.
Utilization report
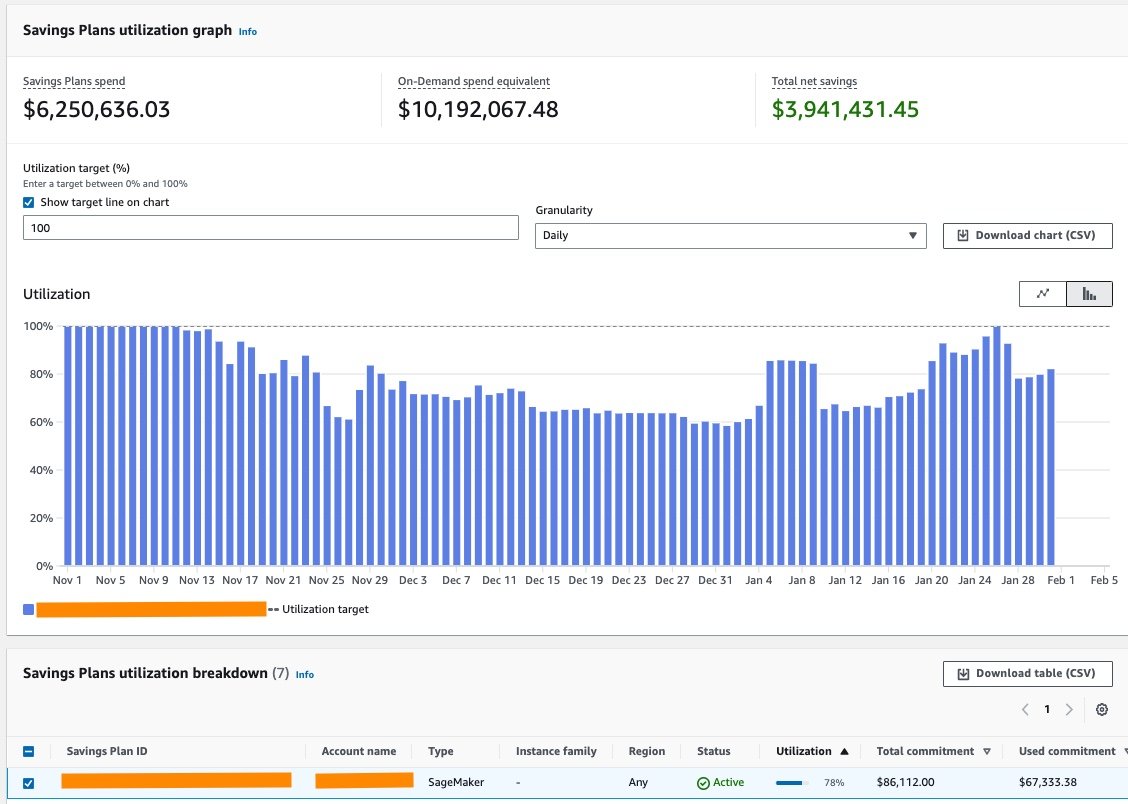
For active Savings Plans, utilization reports are available on the Savings Plans console to see the percentage of the commitment that you’ve actually used. You can use your Savings Plans utilization report to visually understand how much of your Savings Plans commitment you are using over the configured time period, as well as your savings as compared to On-Demand prices. For example, if you have a $10/hour commitment, and your usage billed with Savings Plans rates totals to $9.80 for the hour, your utilization for that hour is 98%. You can see your Savings Plans utilization at an hourly, daily, or monthly granularity, based on your lookback period. You can apply filters by Savings Plans type, member account, Region, and instance family in the Filters section. If you’re a user in a management account, you can see the aggregated utilization for the entire Consolidated Billing Family.
The following screenshot shows an example of a utilization report. You can see that even though Savings Plans coverage is not 100% on many consecutive days, the total net savings is still positive. Without Savings Plans, you would be charged at On-Demand rates for the usage. To realize maximum savings and avoid over-committing, it’s recommended to select the right commitment based on consistent, optimized usage of your SageMaker workloads.
Coverage report
Likewise, coverage reports show you how much of your eligible spend has been covered by the plan. To understand how the coverage is calculated, refer to Using your coverage report.
The following screenshot shows an example of a coverage report. You can see that the average coverage for the selected time period is 92%, along with the On-Demand spend that was not covered by the plan. Based on the On-Demand spend not covered by the plan, you can optionally buy an additional Savings Plan to obtain maximum savings. Also, it’s recommended to right-size the SageMaker compute instances before purchasing a Savings Plan and understand the workload size to avoid over- or under-committing the Savings Plan usage.
For more details on how Savings Plans apply to your AWS usage, refer to Understanding how Savings Plans apply to your AWS usage.
Conclusion
Machine learning has established itself as a powerful tool across industries, but training new models and running ML models for inference can be costly. One of the advantages of running ML on SageMaker is the wide and deep feature set offering cost optimization strategies without impacting performance or agility. This post highlighted the AWS tools and options to analyze your SageMaker costs, identify trends, and implement proactive alerts and optimization best practices.
Refer to the following posts in this series for more information about optimizing cost for SageMaker:
|
About the Authors
 Deepali Rajale is a Senior AI/ML Specialist at AWS. She works with enterprise customers providing technical guidance with best practices for deploying and maintaining AI/ML solutions in the AWS ecosystem. She has worked with a wide range of organizations on various deep learning use cases involving NLP and computer vision. She is passionate about empowering organizations to leverage generative AI to enhance their use experience. In her spare time, she enjoys movies, music, and literature.
 Uri Rosenberg is the AI & ML Specialist Technical Manager for Europe, Middle East, and Africa. Based out of Israel, Uri works to empower enterprise customers on all things ML to design, build, and operate at scale. In his spare time, he enjoys cycling, hiking, and time traveling.


