In recent years, FM sizes have been increasing. It is important to consider the massive amount of compute often required to train these models. The compute clusters used in these scenarios are composed of more than thousands of AI accelerators such as GPUs or AWS Trainium and AWS Inferentia, custom machine learning (ML) chips designed by Amazon Web Services (AWS) to accelerate deep learning workloads in the cloud.
When using compute clusters of massive size, a single failure can often throw a training job off course and may require multiple hours of discovery and remediation from customers. According to a report from OPT-175B training, about 178,000 GPU hours were wasted due to various training failures, amounting to 16 percent of the total training time. Similarly, a study by Meta AI and Carnegie Melon university found that, in the worst cases, 43 percent of compute time was wasted because of overheads due to hardware failures. This can adversely impact a customer’s ability to keep up with the pace of innovation in generative AI and can also increase the time-to-market for their models.
Amazon SageMaker HyperPod is a service that is purpose-built to accelerate FM training, removing the undifferentiated heavy-lifting involved in managing and optimizing a large training compute cluster. With SageMaker HyperPod, you can train FMs for weeks to months without disruption. To make FM training more resilient to hardware failures, SageMaker HyperPod continually monitors cluster health, repairs and replaces faulty nodes without disrupting training, and uses customer-defined checkpoints to automatically resume training from the last point of failure.
Why SageMaker HyperPod?
SageMaker HyperPod offers several benefits that make it a good choice for FM training:
- Standby pool of nodes at no additional cost – SageMaker HyperPod provisions and manages a pool of spare nodes on the customer’s behalf. These nodes are on standby and can be automatically used to replace faulty nodes during training. This makes it so that failures don’t interrupt or delay large-scale training jobs, and these spare nodes come at no additional cost to the user. With the SageMaker HyperPod auto-resume functionality, the service can dynamically swap out unhealthy nodes for spare ones to ensure the seamless continuation of the workload.
- Cluster placement groups for optimized training – Each instance group is launched in a cluster placement group within the same network spine, in order to get the best inter-node latency and maximize bandwidth between nodes. This is ideal for tightly coupled workloads like distributed training where low-latency communication is essential for synchronizing gradient updates and ensuring that model training scales effectively across multiple GPUs.
- Preconfigured deep learning AMI with essential libraries – The SageMaker HyperPod agent runs a SageMaker HyperPod DLAMI, which is built on top of AWS Deep Learning Base GPU AMI (Ubuntu 20.04).The SageMaker HyperPod DLAMI is bundled with additional packages to support open source tools such as Slurm and dependencies. Also included are SageMaker HyperPod cluster software packages, which support features such as cluster health check and auto-resume.
- Reusable scaling scripts for rapid experimentation – HyperPod offers a set of scalable and reusable scripts that simplify the process of launching multiple training runs. These scripts streamline infrastructure setup and deployment and can be easily adapted for different training scenarios or to run many jobs in parallel, making large-scale training more manageable. By reducing repetitive tasks and providing reusable automation, these scripts empower users to quickly scale up or down, test different model variations, and iterate faster, improving productivity and reducing operational overhead.
- Auto-resume functionality – This is one of the most valuable features of SageMaker HyperPod. When a node fails, SageMaker HyperPod automatically replaces it with a healthy node from the spare pool and resumes the job from the last saved checkpoint with minimal disruption to training. This is particularly crucial for long-running training jobs, where even minor interruptions can lead to significant delays.
- Real-time performance dashboards with few-click setup – SageMaker HyperPod integrates seamlessly with real-time dashboards to monitor node health, GPU utilization, network traffic, and other key metrics. This can be done with just a few clicks, providing full visibility into training jobs and allowing teams to optimize performance in real-time.
In this post, we present to you an in-depth guide to starting a continual pre-training job using PyTorch Fully Sharded Data Parallel (FSDP) for Mistral AI’s Mathstral model with SageMaker HyperPod. We review components of the Slurm orchestrated SageMaker HyperPod cluster setup, primarily focusing on the resiliency and feature set of SageMaker HyperPod, including automatic fault detection and integration with open source tools such as Amazon Managed Service for Prometheus and Amazon Managed Grafana.
Overview of SageMaker HyperPod resiliency
Some of the health check metrics used by SageMaker HyperPod include:
- Accelerator issues Checks for GPU issues including DCGM policies like XID errors, GPU health through nvidia-smi, and Trainium issues by reading from Neuron sysfs
- Networking issues – Elastic Fabric Adapter (EFA)
- Health checks – Performed to run processes on accelerators and multiple threads on CPUs to achieve 100 percent utilization. This process determines the health of the CPU or accelerator. Specifically, DCGM Diagnostics Level 2 tests are run for GPUs, and CPU health is determined using the Linux stress tool.
SageMaker HyperPod continuously performs health checks on crucial components, including GPUs, AWS Trainium cores, and EFA networking devices. This proactive approach allows for the HyperPod health check agent to identify various hardware failures or potential performance degradation. When hardware failures are detected, SageMaker HyperPod identifies faulty instances and is also able to use its auto-resume functionality to initiate a replacement process without manual intervention. This feature automatically detects hardware failures, seamlessly replaces faulty instances, and resumes jobs from the last saved checkpoint. In addition, SageMaker HyperPod offers you the ability to manually replace a node in the case that you have a node stuck with an issue but is not being fixed by the SageMaker HyperPod auto-resume functionality. You can manually change the state of the node to fail, and SageMaker HyperPod will replace it with a healthy instance. For a more in-depth dive into resiliency with SageMaker HyperPod, refer to the Resiliency section of this post.
Overview of SageMaker HyperPod observability
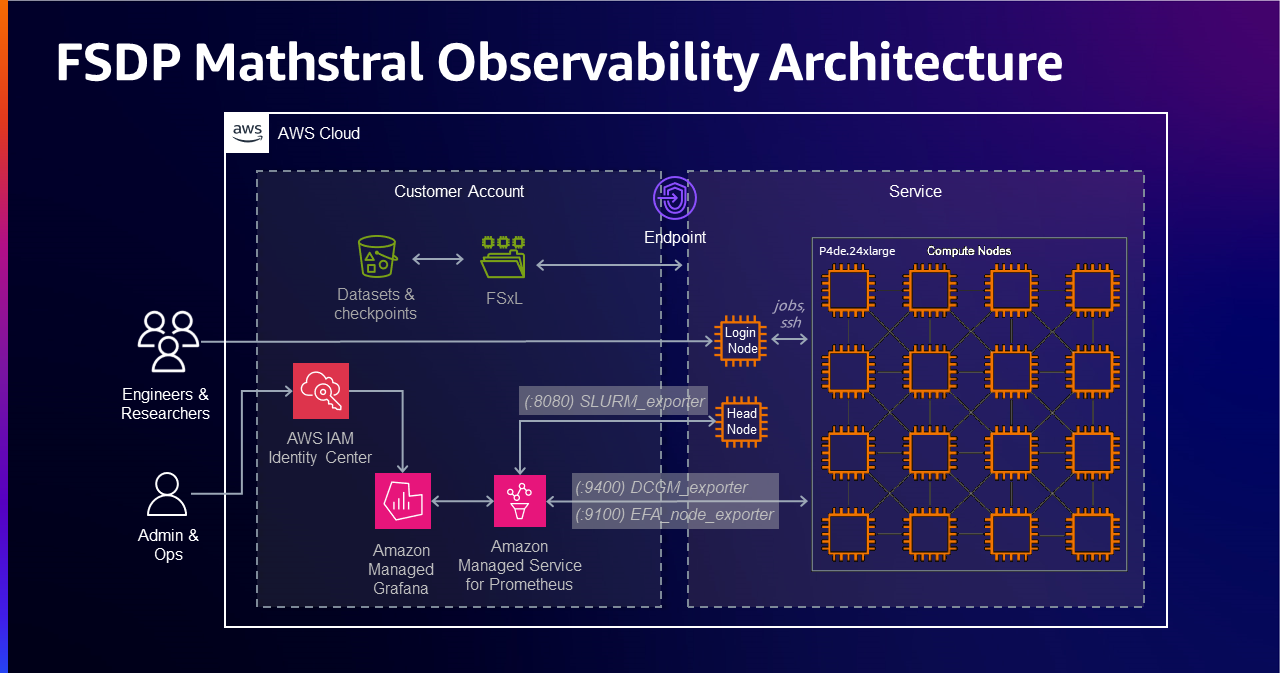
To achieve comprehensive observability into your SageMaker HyperPod cluster resources and software components, you can integrate your cluster with Amazon Managed Service for Prometheus and Amazon Managed Grafana. The integration with Amazon Managed Service for Prometheus enables the export of metrics related to your SageMaker HyperPod cluster resources, providing insights into their performance, utilization, and health. The integration with Amazon Managed Grafana enables the visualization of these metrics through various Grafana dashboards that offer intuitive interface for monitoring and analyzing the cluster’s behavior. By using these services, you gain a centralized and unified view of your SageMaker HyperPod cluster, facilitating proactive monitoring, troubleshooting, and optimization of your distributed training workloads. The Observability section of this post goes into more detail on which metrics are exported and what the dashboards look like in Amazon Managaed Grafana.
This post is primarily focused on Amazon Managed Service for Prometheus and Amazon Managed Grafana for observability. To explore more observability integrations with SageMaker HyperPod like Nvidia Nsight, refer to the validation and observability folder of the awsome-distributed-training GitHub repo.
These resiliency and observability features collectively contribute to a more reliable and efficient training environment, minimize downtime, and optimize resource usage. By directly integrating with Amazon Managed Service for Prometheus and Amazon Managed Grafana and abstracting the management of hardware failures and job resumption, SageMaker HyperPod allows data scientists and ML engineers to focus on model development rather than infrastructure management.
Mathstral model from Mistral AI
Mathstral is a model designed for math reasoning and scientific discovery, is based on the original Mistral 7B model, and features a 32k context window. The release of Mathstral aligns with Mistral AI’s broader effort to support academic and scientific research, particularly through their collaboration with Project Numina. As a 7B model, Mathstral sets a new standard on the performance and latency space for math and reasoning generation compared to similar models used for math and reasoning. Mathstral can achieve significantly better results with more inference-time computation.
Overview of PyTorch FSDP
In distributed data parallel (DDP) training, each process or worker owns a replica of the model and processes a batch of data. Then, it uses all-reduce to sum up gradients over different workers. In DDP, the model weights and optimizer states are replicated across all workers. DDP maintains a full copy of the model on each GPU and requires enough memory on each GPU to store the entire model. For training larger FMs, using an approach like FSDP is recommended, since these FMs require more than a single GPU. It is a type of data parallelism that shards model parameters, optimizer states, and gradients across DDP ranks. This approach reduces the memory requirements on individual GPUs and distributes the memory load across GPUs. With FSDP enhanced efficiency, researchers and developers use fewer GPUs, thereby minimizing operational costs and achieving faster model convergence.
When training with FSDP, the GPU memory footprint is smaller than when training with DDP across all workers. This makes the training of some very large models feasible by allowing them to be loaded into memory with a lower memory footprint. However, this comes at the cost of increased communication volume. For more information on FSDP, refer to PyTorch FSDP: Experiences on Scaling Fully Sharded Data Parallel.
Solution overview
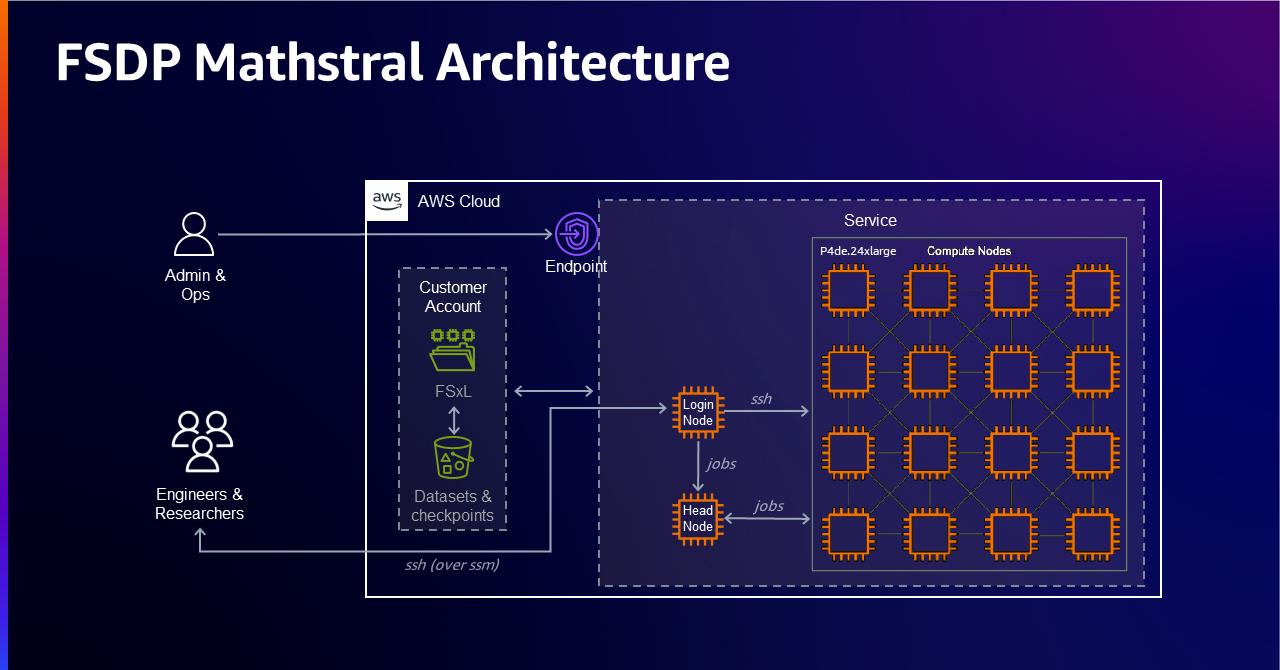
The following image shows the architecture diagram for the resources deployed as part of Sagemaker HyperPod for our use case of training the Mathstral model. In your account, you will have a VPC provisioned with a public and private subnet, and an S3 bucket synced to your FSxL file system via a data repository link. In the service team account, your cluster of P4de instances is provisioned, along with the head node, and the login node, for you to submit the training job to your cluster.
Prerequisites
In the context of this post, we use four p4de.24xlarge instances. You can find more information on the p4de.24xlarge instance type at Amazon EC2 P4 Instances. To get the best inter-node latency, we launch these instances together in a cluster and only run jobs on a single instance group. You can also use a variety of other instance types to follow along with this post.
For more information on getting access to instances in a partition group, refer to the Getting Started section in this post. Note that Mathstral 7B at full precision (FP32) is approximately 26 GB in size so you need to make sure that your cluster configuration has sufficient GPU memory to load the model into memory along with the gradients, activations, and moments. This should account for a total of 107 GB in addition to the training assets required to kick off a job successfully. For demonstration purposes, we use FSDP for this continued pre-training job.
The following sections describe setting up your infrastructure and environment with SageMaker HyperPod. For detailed instructions and code, we recommend that you follow along with the Amazon SageMaker HyperPod workshop. The prerequisites and cluster setup parts of this workshop go over all the required components needed in order to set up your cluster. The workshop also provides resources to troubleshoot commonly faced issues during setup.
Set up your infrastructure
Deploy HyperPod VPC stack
To set up your cluster, you first need to create some resources. The following resources can be created by deploying this SageMaker HyperPod VPC CloudFormation stack. By default usw2-az4 is specified as the Availability Zone. Change this to reflect the Availability Zone where you have your cluster. This VPC stack creates the following resources:
- Subnet – This is a private subnet in the Availability Zone id that you choose to use
- Security group – This allows SageMaker HyperPod to mount your Amazon FSx for Lustre file system
- FSx for Lustre file system – This serves as the shared file system that all the nodes can access. It’s a
1.2 TBPERSISTENT_2 file system in the private subnet you create. It gets mounted at/fsx. - Linux environment – This provides a standardized development environment to work in
- Amazon Simple Storage Service (Amazon S3) bucket – To push and store your lifecycle scripts
- AWS Identity and Access Management (IAM) role – Role required for creating the SageMaker HyperPod cluster
Deploy the observability stack
In order to use the observability integration with SageMaker HyperPod, you need to deploy the SageMaker HyperPod Observability CloudFormation stack, which can then be used to monitor your cluster metrics in real time.
Set up your environment
Let’s move on to environment setup. In order to deploy this solution, you need to use a Linux-based development environment. This section briefly describes the steps required to set up your cluster. For detailed instructions and code, we recommend that you follow along with the Amazon SageMaker HyperPod workshop.
Set up your cluster
This section guides you through the process of deploying a cluster to train with. You need to set up the following:
- Head node and compute nodes – The head node is composed of an
m5.12xlargeinstance, and the worker group consists ofp4de.24xlargeinstances. Refer to the following table for details on these instance types. - Shared volume – The cluster has an FSx for Lustre file system mounted at /fsx on both the head and compute nodes
- Placement groups enabled – A placement group will launch instances close together inside one physical data center in a single Availability Zone to maximize the bandwidth and reduce the latency between instances
- Local storage – Each node will have an 8 TB local NVME volume attached for local storage
- Scheduler – SLURM will be used as a job scheduler
- Accounting – As part of cluster configuration, a local MariaDB is deployed to keep track of job runtime information
| A | B | C | D | E | F | |
| 1 | Instance size | GPU devices | Total GPU memory | VCPUs | CPU memory | EFA bandwidth |
| 2 | p4de.24xlarge | 8 | 640 gb | 96 | 1152 gb | 400 Gbps |
Set up the AWS CLI
Before creating the cluster and its associated resources, you need to set up the AWS Command Line Interface (AWS CLI) using the latest version (or version 2.17.1 at a minimum).
To check the AWS CLI version, use the following command.
To update the AWS CLI to the latest version, use the following command.
The AWS CLI plugin for Session Manager, a capability of AWS Systems Manager, must be installed to access your cluster. To use Amazon Linux 2 to install Session Manager, use the following command:
For detailed steps on installing and setting up the AWS CLI, follow the steps provided in the Install AWS CLI section of the Amazon SageMaker HyperPod workshop.
Source environment variables
An important part of the setup is to source in all the environment variables, using the output from the VPC CloudFormation stack deployed in a previous step. Use the following command.
Once you have sourced them in, confirm that they were correctly set using the following command.
Set up lifecycle scripts
SageMaker HyperPod uses a collection of lifecycle scripts to bootstrap the cluster. These scripts are responsible for several actions, including setting up Slurm and mounting the FSx for Lustre file system. You need to customize these scripts in order to mount your FSx for Lustre file system. For detailed steps on setting up these lifecycle scripts, refer to the Set Up Lifecycle Scripts section of the workshop.
Make sure to complete the Enable Optional Lifecycle scripts section after step 4 of the Set Up Lifecycle scripts section because this is needed in order to enable installation of exporter services on the cluster. This is required because you need the exporter services on the cluster to emit metrics to Amazon Managed Service for Prometheus.
Additionally, the observability stack requires the following two AWS managed IAM policies to be added to your AmazonSagemakerClusterExecutionRole prior to creating your cluster.
Create your cluster
To create your cluster, you need your cluster configuration. Because you use p4de.24xlarge for this example, copy the following cluster configuration.
If you use a different instance type for your cluster, refer to the Create Cluster section of the workshop to create your cluster-config.json file.
SageMaker HyperPod also gives you the ability to update your clusters to increase the size of an existing worker group or create a new worker group to add additional instance-types to your cluster. For steps on updating the cluster to create additional worker groups that use other instance types, refer to the section in the workshop to create Heterogenous Clusters.
Once you’ve created the cluster-config.json file, follow the Create Cluster steps in the workshop to create the FSX for Lustre configuration (provisioning_parameters.json) file and upload it to Amazon S3. Then, you can validate the configuration using the validate-config.py file in the awsome-distributed-training GitHub repo.
Once this validation is completed, you can create your cluster. Use the following command.
To check the state of your cluster, run the following command.
You should then be able to observe the cluster creating.
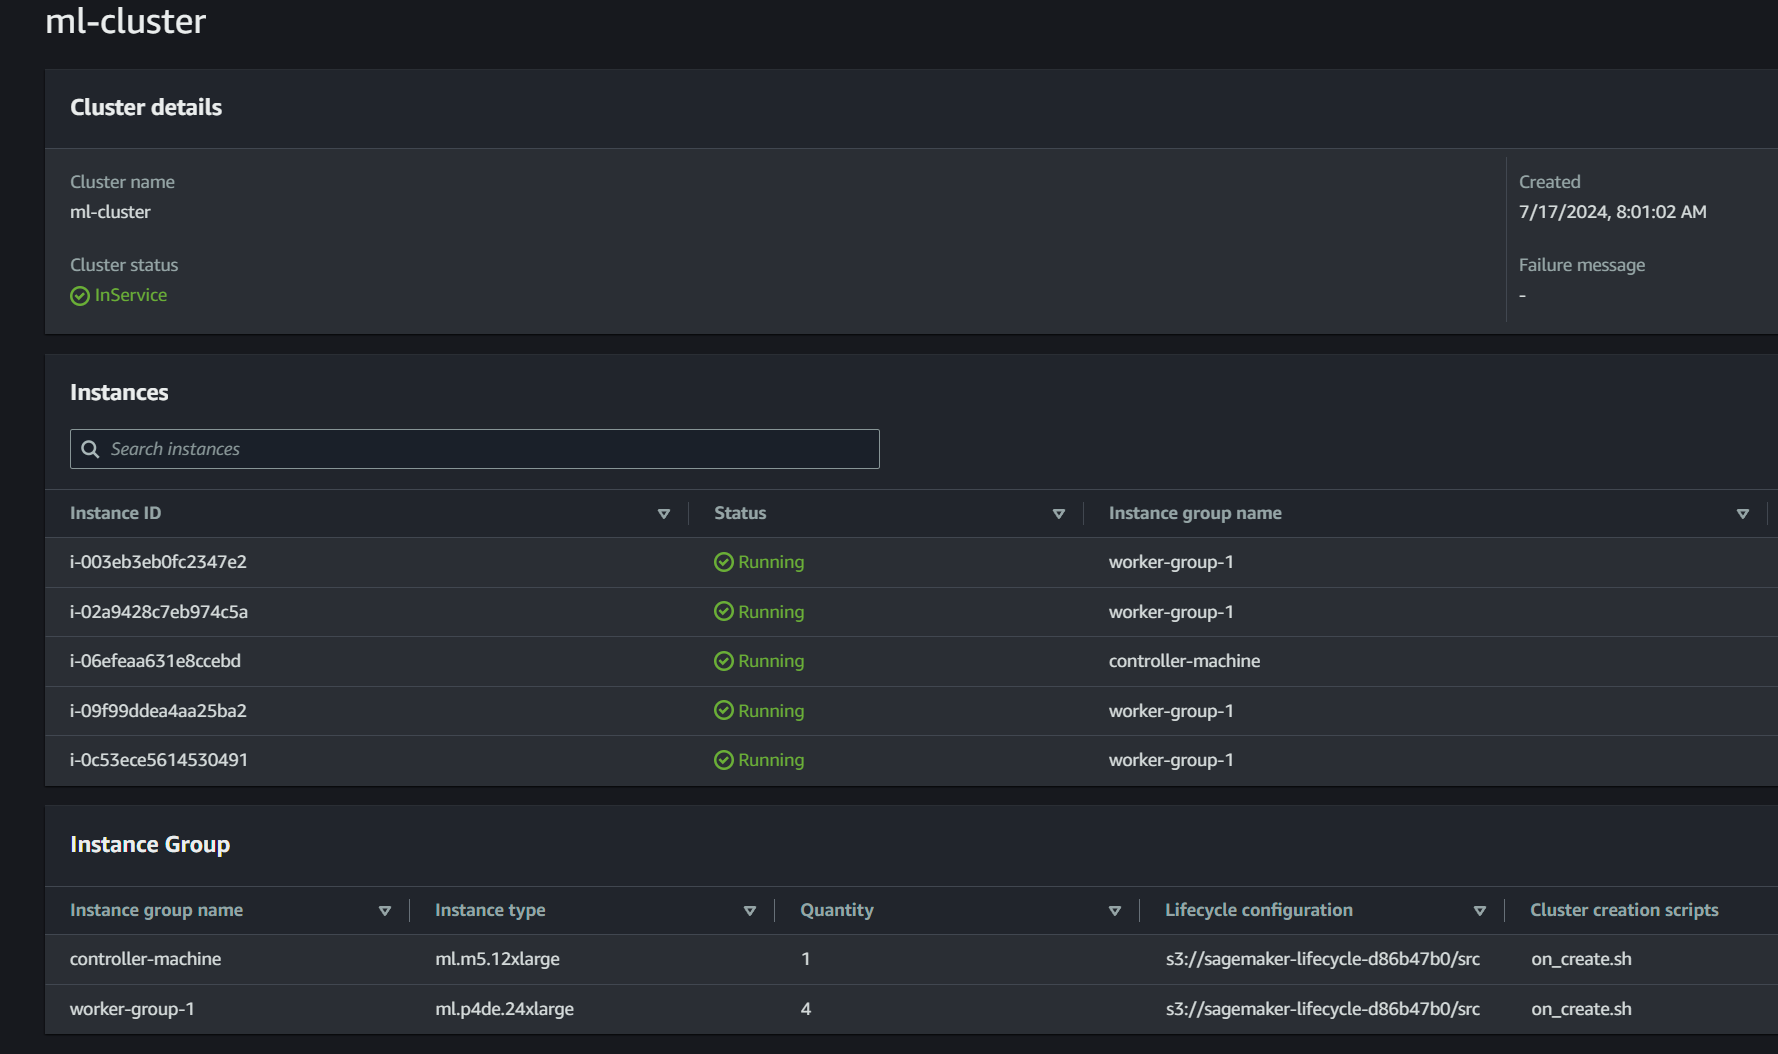
Now that you’ve created a cluster, you can monitor the status in the SageMaker console. This will show you cluster status, running instances, and node groups and allow you to modify the cluster. In the SageMaker HyperPod console, find your cluster and select it, as shown in the following screenshot.
Once the Cluster status changes to InService, you can connect using Secure Shell (SSH). Make sure that you completed the step in Set up the AWS CLI to install the SSM plugin. You can then take the easy-ssh.sh file from the repo to simplify the SSM command connect to the controller-machine using SSH.
Use the following command to switch to the ubuntu user.
Refer to the Get to know your Cluster section in the SageMaker HyperPod workshop to familiarize yourself with the commands you need to use in the later sections.
Finally, set up SSH access to the compute nodes. To do this, add a key-value pair to the /fsx/ubuntu directory. Because all the compute nodes mount this directory, you only have to do this once for ubuntu to access all the compute nodes. For instructions, refer to the SSH Access to compute section of the workshop.
Congrats on setting up your environment! Now that you’ve completed the necessary steps, you can move on to your training job.
Run your pre-training job
Follow these steps on your cluster head node:
- Navigate to your shared FSx for Lustre file system. If you followed the tutorial linked previously, it will be location at
/fsx. - Use the following command to clone the awsome-distributed-training repo.
- Run the
create_conda_env.shscript.
This script will first download and install Miniconda, then create a Conda environment called pt_fsdp. The Conda environment installs PyTorch on AWS, which is a package that is built to run PyTorch workloads on AWS. Specifically, it lets you use EFA out of the box, since OFI-NCCL is pre-built in the Conda package. PyTorch on AWS also provides the latest versions of CUDA, cuDNN, and NCCL for the best performance on GPU-based instances. Dependencies required to run your FSDP training job will be installed in this Conda environment, and since this Conda environment is created on the /fsx file system, it’ll be shared across all your training nodes.
For this training job, you use the C4 dataset, which is several hundred gigabytes. Instead of downloading the whole thing, the create_streaming_dataloaders function will stream the dataset from HuggingFace, so there’s no data prep required for running this training.
If want to use your own dataset instead, you can format it as a HuggingFace dataset and pass its location to the --dataset_path argument.
Launch training
The script to launch the Mathstral training job can be found in 3.distributed-training-mistral-mathstral.sbatch. Depending on the number of nodes in your cluster, you are can adjust them by modifying #SBATCH --nodes=4. Because you are using four p4de.24xlarge instances, it has been set to 4.
For the purpose of this post, you need to make sure that the FI_EFA variables for EFA are exported in the 3.distributed-training-mistral-mathstral.sbatch file. If you use instances not enabled for remote direct memory access (RDMA), such as the g5.12xlarge, comment out lines 21–22 of this file. These instances have EFA between nodes, but do not have the GPU direct RDMA access of p4d/e and p5 instances. In this walkthrough, we are using p4de instances, so we leave these lines uncommented.
Under User Variables, make sure to adjust GPUS_PER_NODE to match the number of GPUs on your instance type (8 for p4de).
You can also adjust the training parameters in TRAINING_ARGS. Additional parameters can be found in model/arguments.py.
We use the same directory for both --checkpoint_dir and --resume_from_checkpoint. If there are multiple checkpoints, --resume_from_checkpoint will automatically select the most recent one. This way, if the training is interrupted for any reason, it will automatically pick up the most recent checkpoint.
Note: You may change these hyperparameters in the 3.distributed-training-mistral-mathstral.sbatch file. We are using arbitrary hyperparameters here for the sake of demonstration.
To launch your training, run the following command.
You’ll find a new file in the FSDP directory of the form slurm-[job-number].out. This will be continuously updated with your training logs. Don’t be worried if you notice a long stream of NCCL logs (we prefer to use NCCL_DEBUG=INFO for verbose logging). After about a minute, you should observe your Mathstral model training, with an output similar to the following.
Observability
SageMaker HyperPod can optionally be integrated with Amazon Managed Service for Prometheus and Amazon Managed Grafana to export metrics about your cluster and cluster-nodes to an Amazon Managed Grafana dashboard.
For more details about configuring Amazon Managed Service for Prometheus and Amazon Managed Grafana, refer to the Prometheus Configuration and Amazon Managed Grafana sections in the SageMaker HyperPod workshop.
Slurm Exporter dashboard
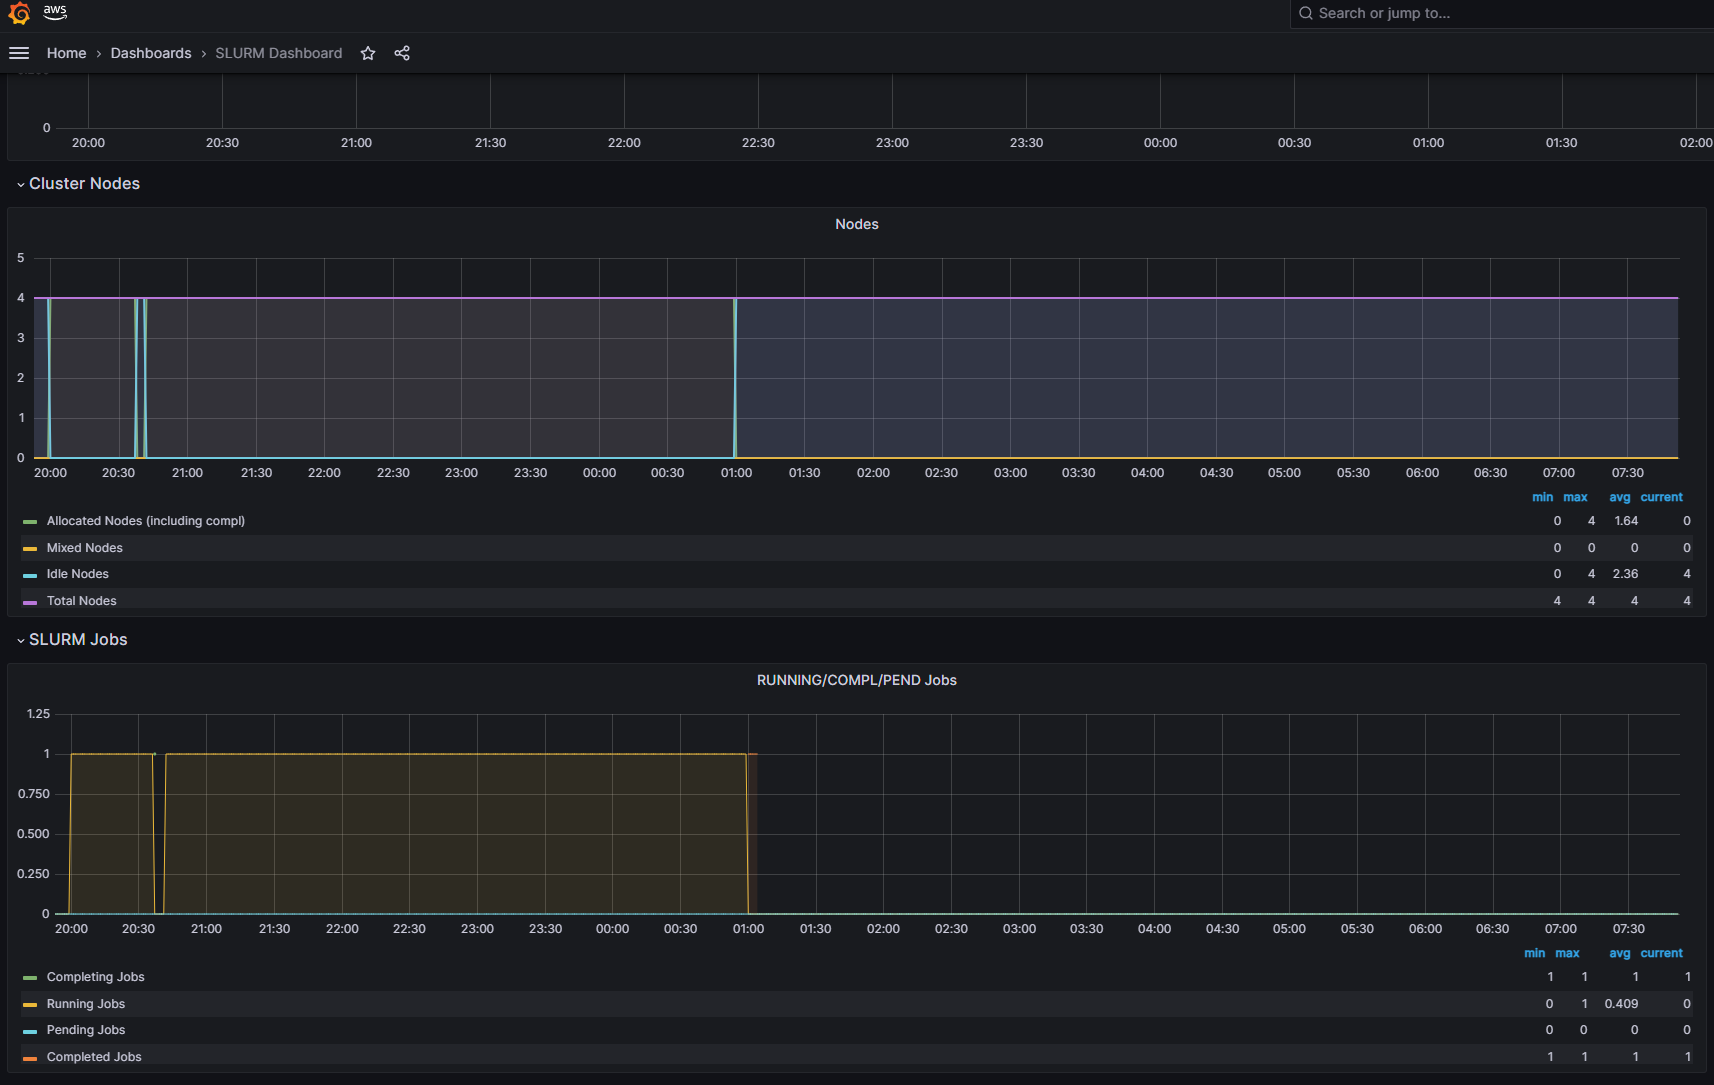
The Amazon Managed Grafana Slurm dashboard (ID: 4323) provides visualization options for monitoring Slurm clusters. Prometheus Slurm exporter is installed on the controller node of the cluster. Some of the metrics exported include:
- Cluster overview – Displays the total number of nodes, jobs, and their states
- Job metrics – Visualizes job counts and states over time
- Node metrics – Shows node states, allocation, and available resources
- Partition metrics – Monitors partition-specific metrics such as CPU, memory, and GPU utilization
- Job efficiency – Calculates job efficiency based on resources used
The following screenshot of the exporter dashboard shows the continued pre-training job for Mathstral being completed successfully.
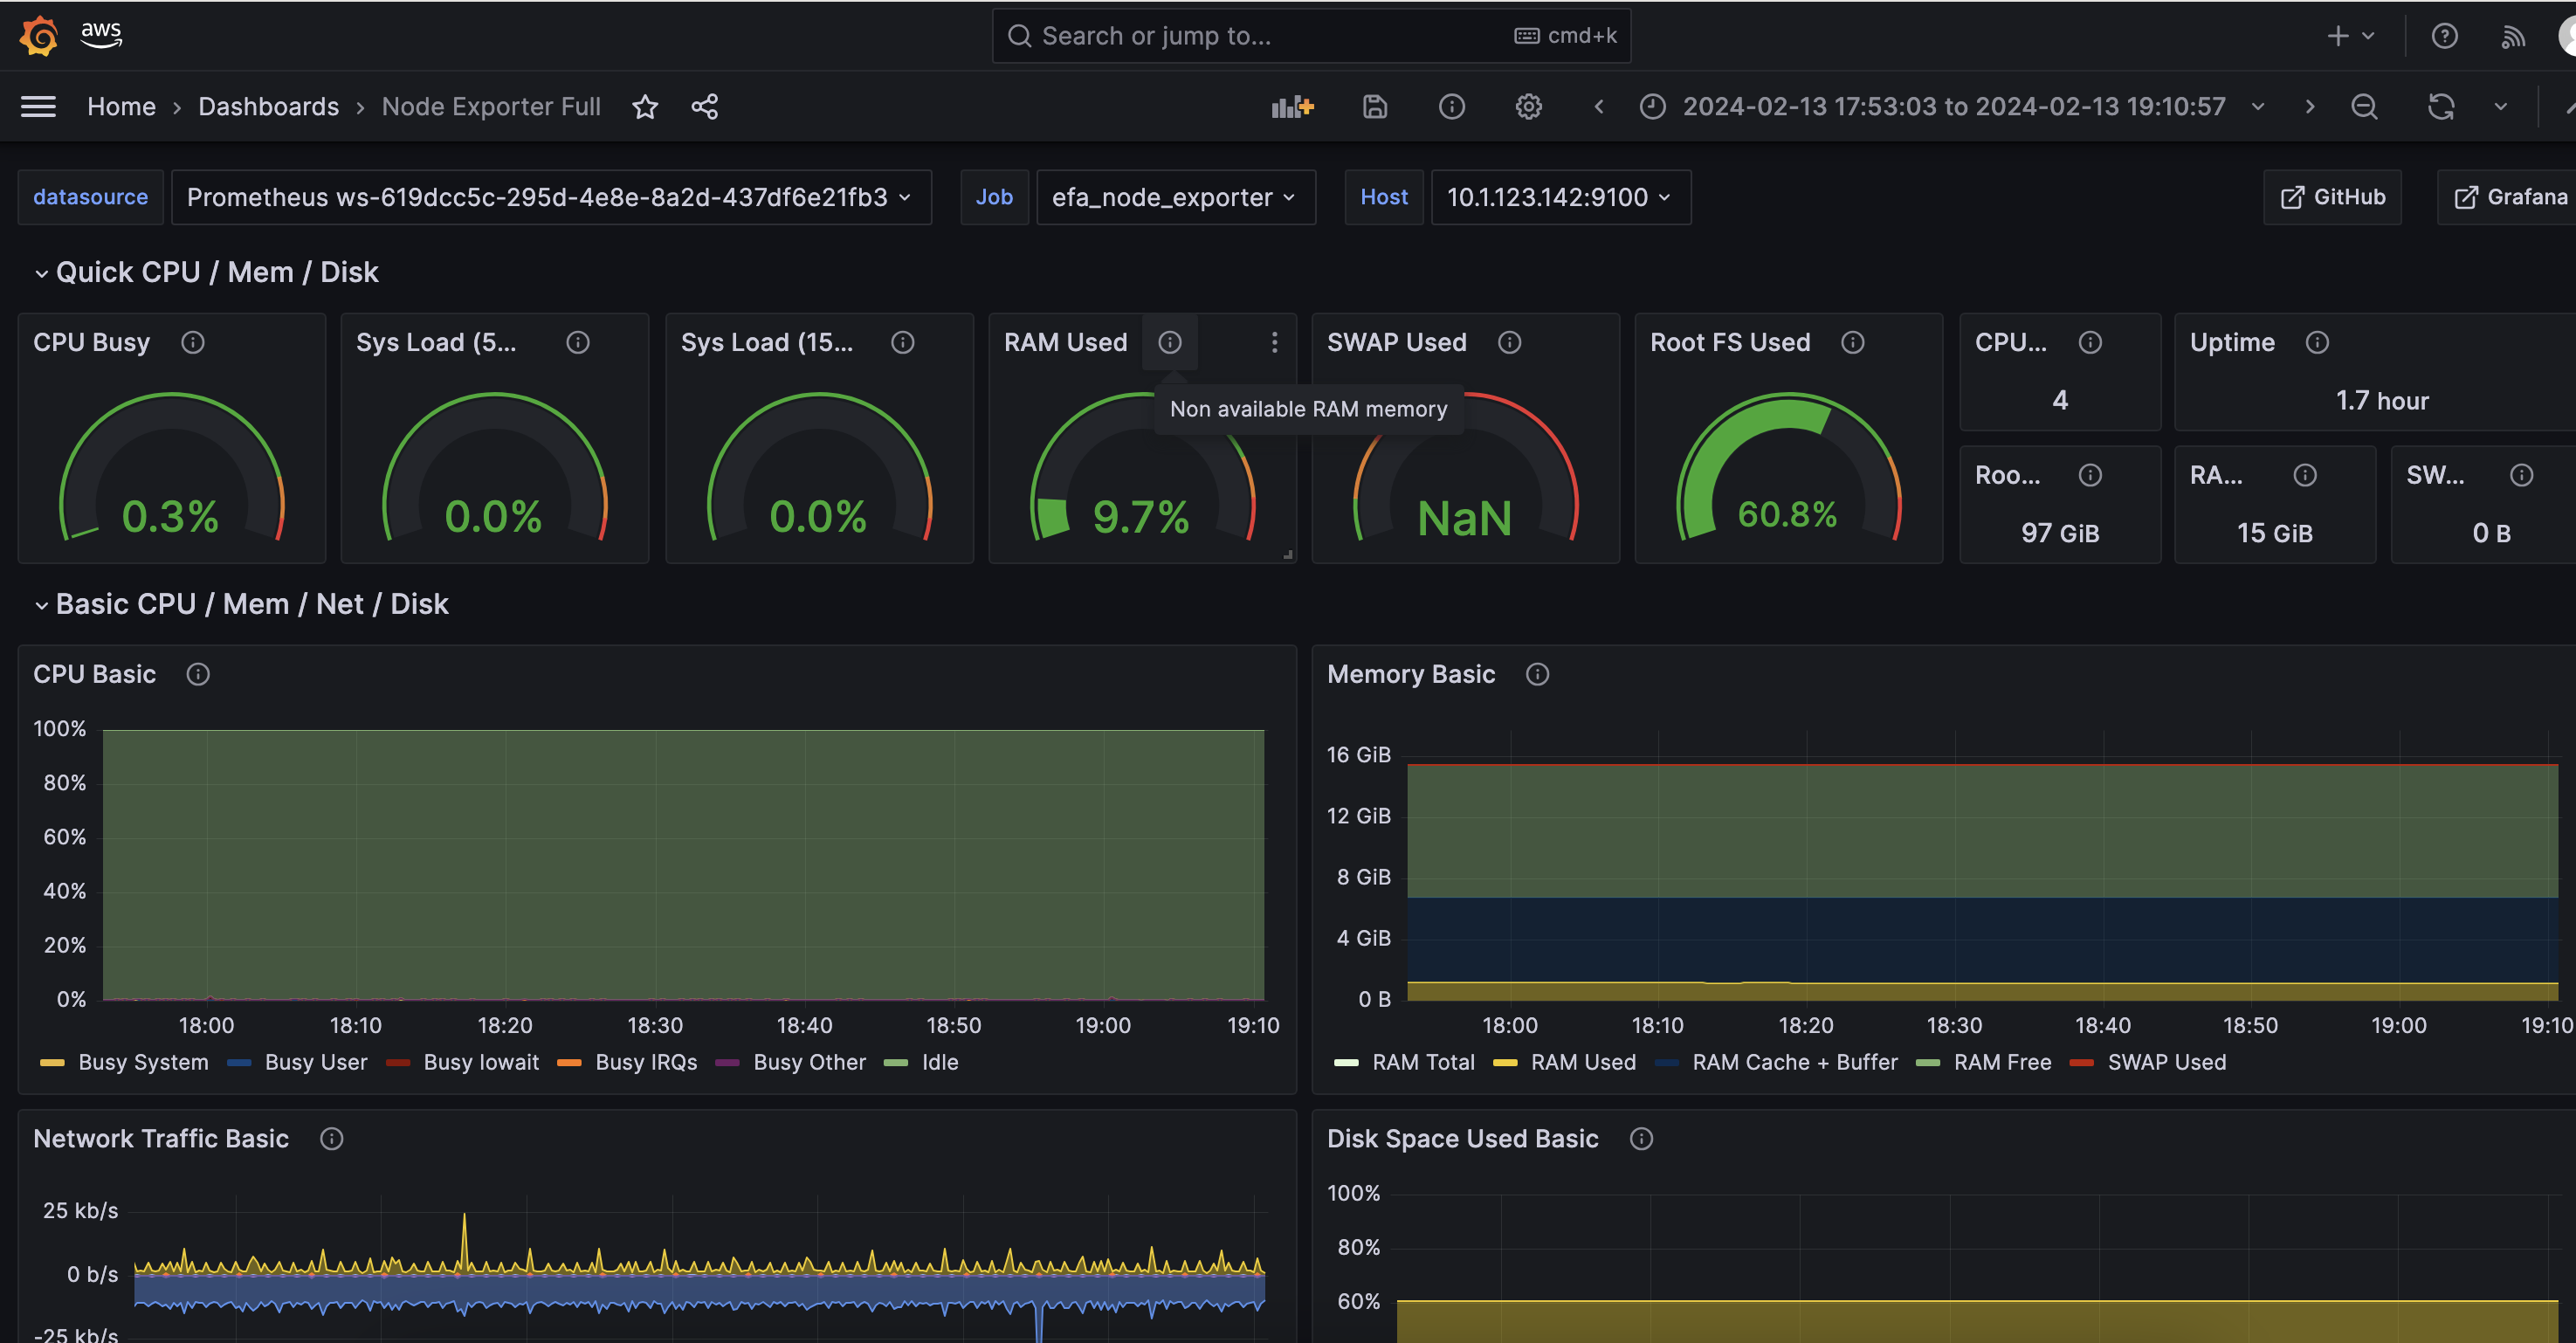
Node Exporter dashboard
The Amazon Managed Grafana Node Exporter Full dashboard (ID: 1860) offers visualization options for monitoring system metrics collected by the Prometheus Node Exporter installed on the cluster nodes. Some of the key metrics you can visualize include:
- System overview – Displays CPU load averages and memory usage
- Memory metrics – Visualizes memory utilization including total memory, free memory, and swap space
- Disk usage – Monitors disk space utilization and availability
- Network traffic – Shows network bytes received and transmitted over time
- File system metrics – Analyzes file system usage and availability
- Disk I/O metrics – Visualizes disk read and write activity
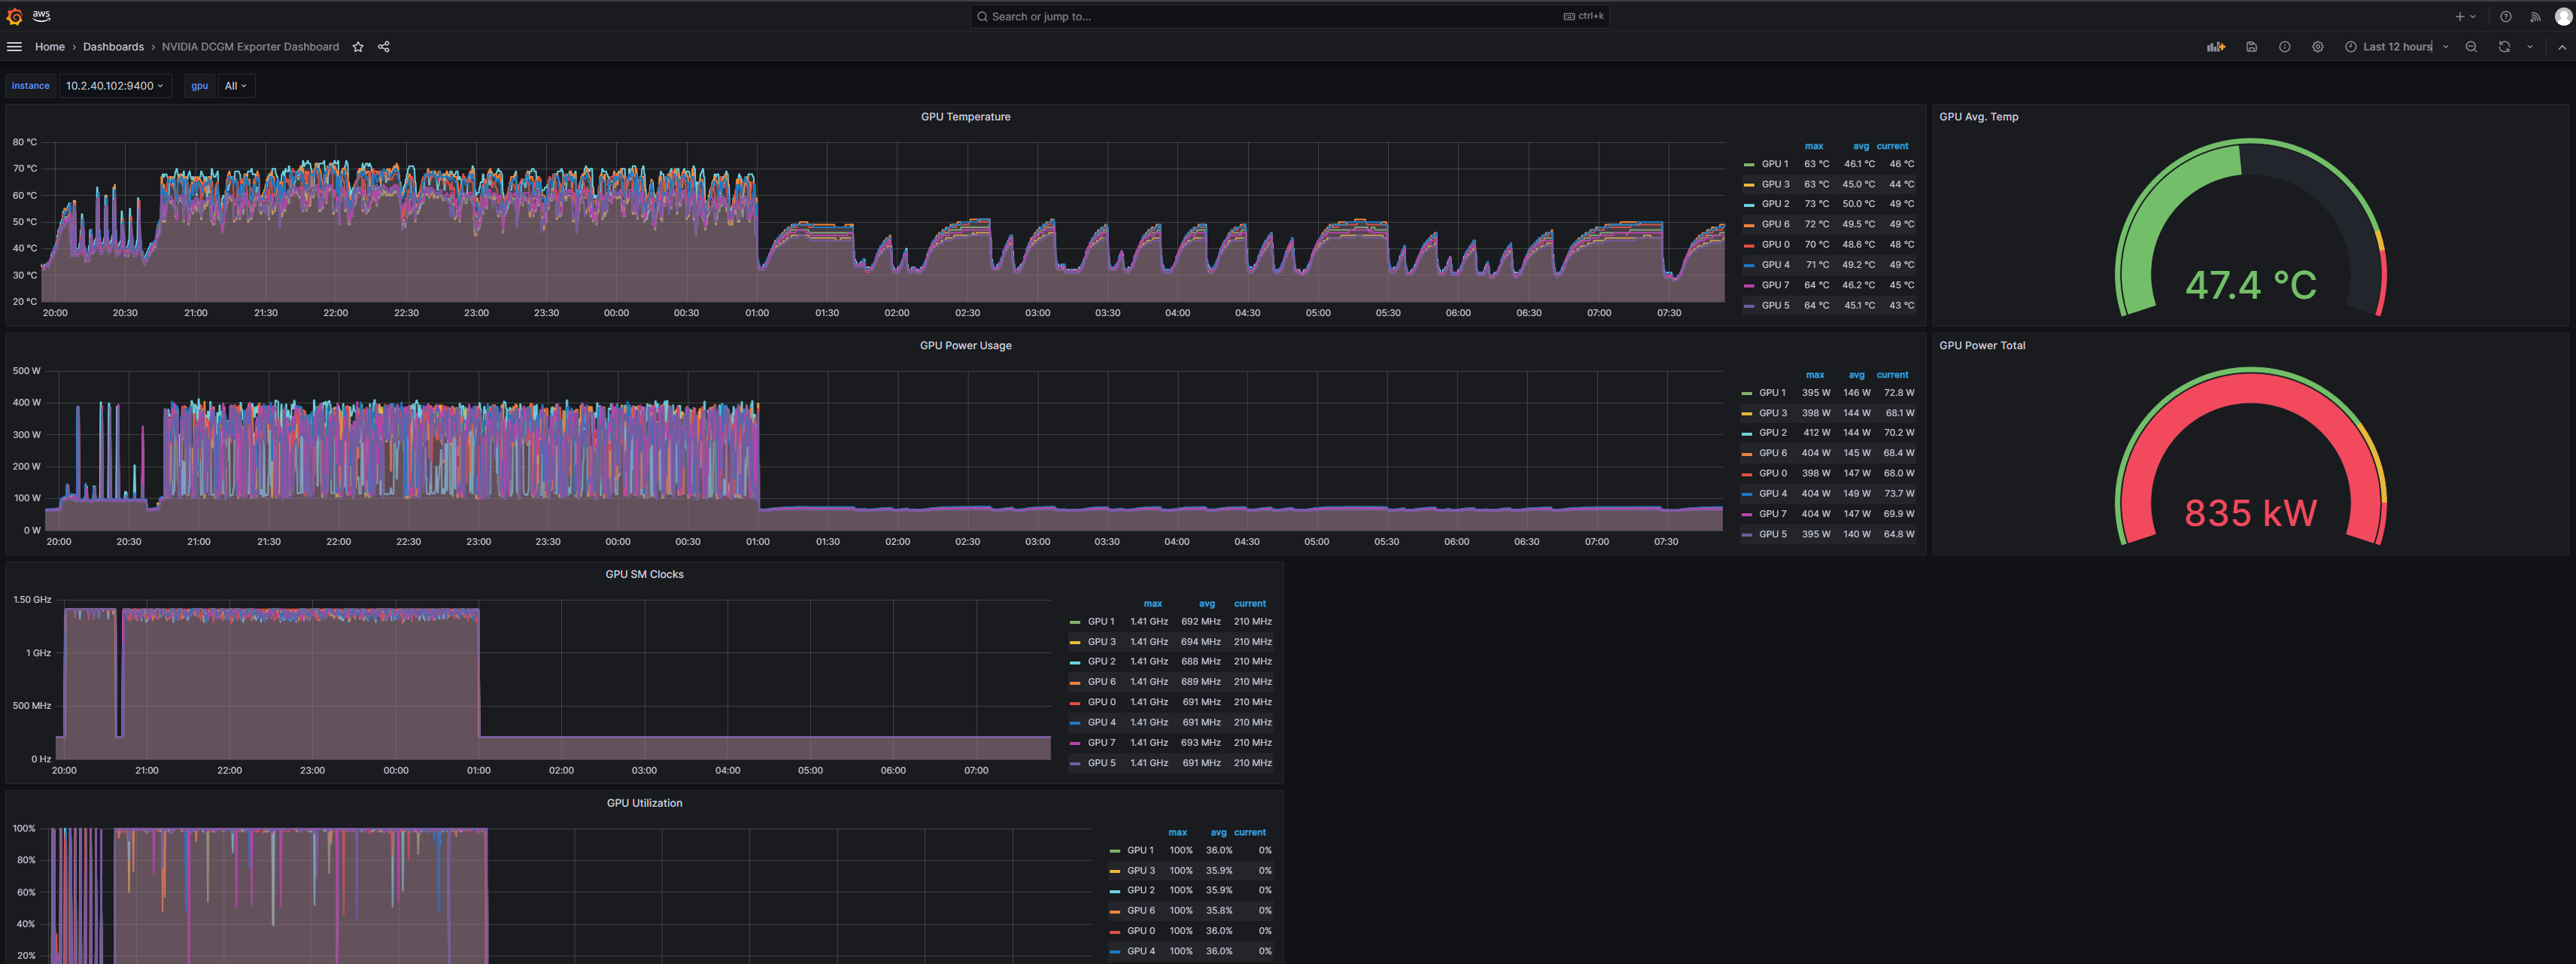
DCGM Exporter dashboard
The Amazon Managed Grafana NVIDIA DCGM Exporter dashboard (ID: 12239) offers visualization options for monitoring NVIDIA GPU metrics collected by the DCGM Exporter. Some of the key metrics you can visualize include:
- GPU overview – Displays GPU utilization, temperatures, power usage, and memory usage
- Temperature metrics – Visualizes GPU temperatures over time
- Power usage – Monitors GPU power draw and power usage trends
- Memory utilization – Analyzes GPU memory usage, including used, free, and total memory
- Fan speed – Shows GPU fan speeds and variations
- ECC errors – Tracks GPU memory ECC errors and pending errors
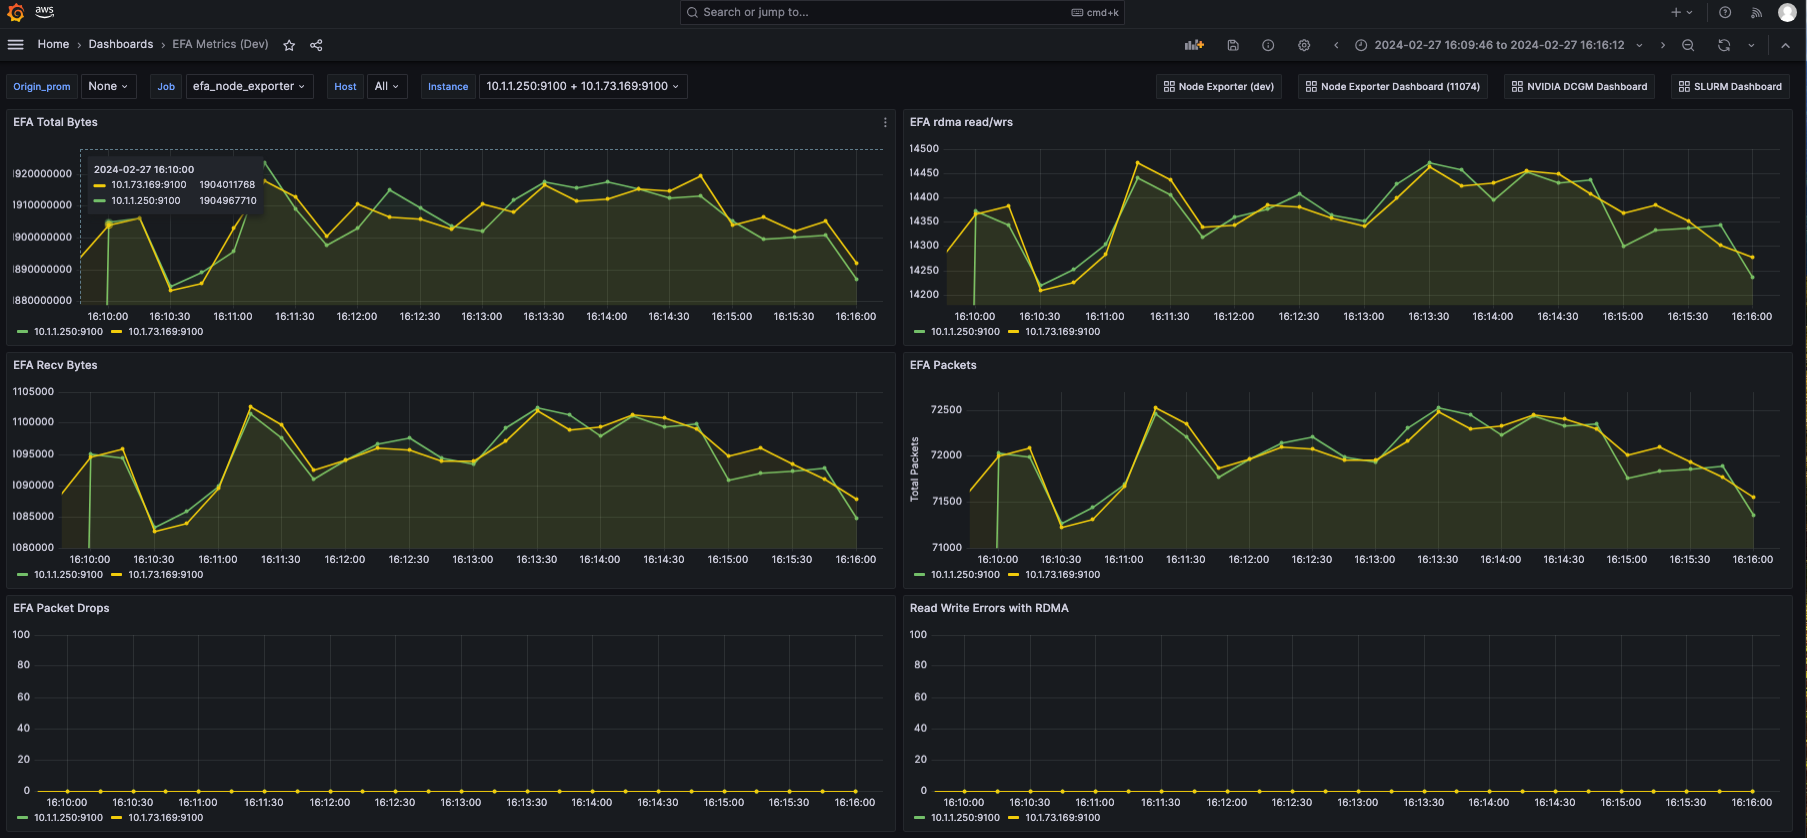
EFA Metrics dashboard
The Amazon Managed Grafana EFA Metrics dashboard (ID: 20579) offers visualization options for monitoring EFA related metrics collected by the EFA Node Exporter. Some of the key visualizations include:
- EFA error metrics – Visualizes errors such as allocation errors, command errors, and memory map errors
- EFA network traffic – Monitors received and transmitted bytes, packets, and work requests
- EFA RDMA performance – Analyzes RDMA read and write operations, including bytes transferred and error rates
- EFA port lifespan – Displays the lifespan of EFA ports over time
- EFA keep-alive packets – Tracks the number of keep-alive packets received
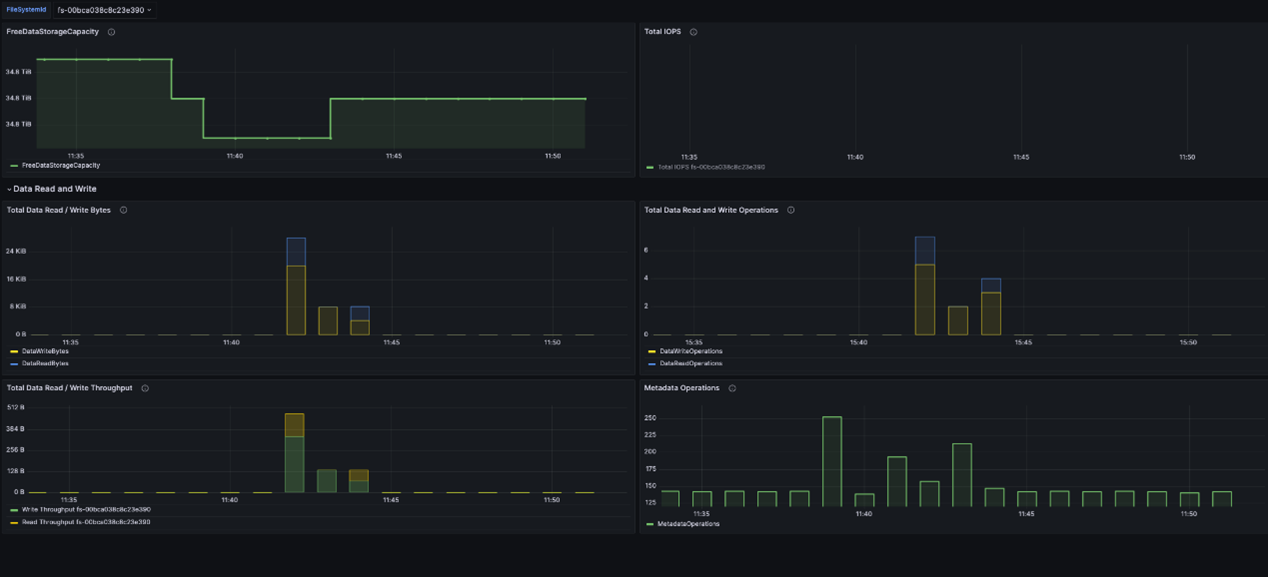
FSx Metrics dashboard
The Amazon Managed Grafana FSx for Lustre dashboard (ID: 20906) offers visualization options for monitoring Amazon FSx for Lustre file system related metrics collected by Amazon CloudWatch. Some of the key visualizations include:
- DataReadBytes – The number of bytes for file system read operations
- DataWriteBytes – The number of bytes for file system write operations
- DataReadOperations – The number of read operations
- DataWriteOperations – The number of write operations
- MetadataOperations – The number of metadata operations
- FreeDataStorageCapacity – The amount of available storage capacity
These metrics provide insights into various aspects of your FSx for Lustre file systems.
Resiliency
As mentioned previously, one of the value propositions of SageMaker HyperPod is that it provides a variety of cluster resiliency features such as cluster health checks, auto-resume, and the option to manually replace faulty nodes.
Based on the status of these health checks, SageMaker HyperPod detects whether nodes in the cluster are healthy or not. If a node is deemed unhealthy by any of the health checks, SageMaker HyperPod uses its auto-resume feature to automatically replace the faulty node, without any manual intervention.
Additionally, users have the option to implement checkpointing in their training procedure. Checkpointing, combined with auto-resume, means that once a faulty node is replaced, the training job can resume from the last saved checkpoint. This way, despite a hardware failure, a user’s training job can run with minimal loss in progress.
In this section, we demonstrate the resiliency and auto-resume feature of SageMaker HyperPod by simulating a hardware failure scenario and pointing you towards some logs that indicate the success of a replacement job. We use the same submitted FSDP training job, which has the following two important components enabled:
- Checkpointing is enabled and implemented
- The
--auto-resume=1flag is set. You can verify this in the SLURM .out
This section in the provided sbatch file sets the --auto-resume=1 flag.
The sbatch file has the checkpointing flags checkpoint_freq, checkpoint_dir, resume_from_checkpoint, which tell the job how often to write checkpoints, where to write the checkpoints to, and what directory to read checkpoints from in case of failure, respectively.
Assuming that you already have your training job submitted, wait until a few checkpoints are written to the ./checkpoints directory (or the directory name you specified for checkpoint_freq. You can check whether any checkpoints were written by running ls -lt checkpoints/. This should return an output that resembles the following.
You may also check the progress of your training job by running tail -f slurm-<job-id>.log, where <job-id> can be derived by running squeue. You should observe an output that resembles the following.
Once you’ve confirmed that your training job is running and that you have checkpoints written, you are ready to simulate a hardware failure.
As part of the output of running squeue, you have received an output that resembles the following.
This tells you what jobs are running and on what nodes. Locate your training job and choose any of the nodes except the first node on the list of nodes allocated to your job (this is the node that you will be injecting an error into). This is very important because PyTorch uses node 0 (that is, the first node) as the coordination node for your training job.
Once you’ve identified the node to inject the error onto, connect to it using SSH with following command.
You can inject an ECC error by running the following command.
This simulates a double-bit error (DBE) in the GPU of your chosen node. Additionally, to kill the training job to simulate a job failure, you can take the process id (PID) of any of the python processes running. The Python processes are the training job processes running your FSDP training job. The -9 flag here is the signal number for the SIGKILL signal, which forces a process to stop, without giving it a chance to clean up, or perform any other actions.
Once the ECC error is injected and the Python process has stopped, you can exit out of your compute node. In the meantime, you can get the output of the slurmctld.log file using the following command.
In there, you can observe the following lines, which show a failed job or node.
Pay attention to the line that says update_node: node ip-10-2-39-253 reason set to: Action:Replace, which is the log that says that the node has failed and requires replacement.
If you look at your <slurm-job>.out file, you should observe logs like the following.
This shows that job 35 (your training job) is paused and a new job (job 35) has initiated the replacement process. You can verify this by running squeue, where you will observe an auto-res. This is the auto-resume job that is initiated by SageMaker HyperPod to replace your faulty node.
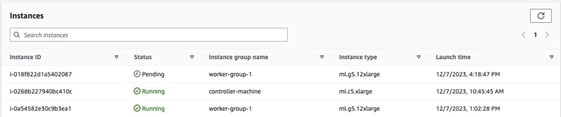
You can also monitor your SageMaker HyperPod cluster using the AWS console. Under Instances, you should observe one of the nodes in worker-group-1 in Pending state, as shown in the following screenshot. This shows that the node is about to get replaced.

Once your node is replaced, you can observe the slurmctld.log file. Be on the alert for the following line:
You can also verify that your node was successfully replaced using the HyperPod cluster tab in the Amazon SageMaker console.
Once your node is replaced, squeue should no longer display the auto-res job and should only display your original training job. The node is successfully replaced, without any manual intervention.
Because you enabled checkpointing, you can verify that the training job resumes from the latest checkpoint. In your <slurm-job>.out file, find the following lines, which show that a checkpoint was detected in the checkpoint directory (./checkpoints) and that the latest checkpoint was loaded, respectively.
If you continue to monitor your <slurm-job>.out file, you should observe that your training job has resumed from the latest checkpoint.
Clean up
- To delete your cluster, enter the following command.
Once you are done deleting the cluster, make sure it is deleted in the SageMaker HyperPod clusters section under SageMaker.
- To use the console to delete your SageMaker HyperPod VPC and Observability CloudFormation stacks, follow the directions at Delete a stack from the CloudFormation console. Alternatively, use the AWS CLI by entering the following command. Replace
my-stackwith the name of your stacks.
Conclusion
In this post, we provided a comprehensive guide on using Amazon SageMaker HyperPod for training large-scale models such as Mistral AI’s Mathstral using PyTorch Fully Sharded Data Parallel (FSDP). The process highlighted the efficiency of distributed training on SageMaker HyperPod, showcasing the critical role of resiliency and observability features in maintaining uninterrupted, scalable training environments.
Because of the integration with tools such as Amazon Managed Service for Prometheus and Amazon Managed Grafana for real-time monitoring, along with the robust cluster management capabilities of SageMaker HyperPod, ML practitioners can focus on model development rather than infrastructure management. The detailed steps for setting up the infrastructure, deploying the observability stack, and running a training job demonstrate how SageMaker HyperPod helps tackle the complexities of distributed training.
Moreover, the automatic health checks and the auto-resume feature significantly reduce downtime and minimize the impact of hardware failures so that large-scale training jobs can proceed with minimal interruptions. This level of resilience is crucial for maintaining the pace of innovation in AI research, especially when dealing with massive FMs.
By following the outlined procedures and using the powerful tools provided by AWS, data scientists and engineers can optimize their training workflows, reduce operational overhead, and accelerate the development of state-of-the-art models.
Getting Started
Interested in getting started with SageMaker HyperPod? Reach out to your AWS Account Team or email aws-frameworks-gtm@amazon.com. To begin experimenting with other examples on SageMaker HyperPod, refer to the awsome-distributed-training GitHub repo and the Amazon SageMaker HyperPod workshop.
About the Authors
 Niithiyn Vijeaswaran is a Solutions Architect at AWS. His area of focus is generative AI and AWS AI Accelerators. He holds a Bachelor’s degree in Computer Science and Bioinformatics. Niithiyn works closely with the Generative AI GTM team to enable AWS customers on multiple fronts and accelerate their adoption of generative AI. He’s an avid fan of the Dallas Mavericks and enjoys collecting sneakers.
 Aman Shanbhag is an Associate Specialist Solutions Architect on the ML Frameworks team at Amazon Web Services, where he helps customers and partners with deploying ML Training and Inference solutions at scale. Before joining AWS, Aman graduated from Rice University with degrees in Computer Science, Mathematics, and Entrepreneurship.
 Armando Diaz is a Solutions Architect at AWS. He focuses on generative AI, AI/ML, and data analytics. At AWS, Armando helps customers integrate cutting-edge generative AI capabilities into their systems, fostering innovation and competitive advantage. When he’s not at work, he enjoys spending time with his wife and family, hiking, and traveling the world.
 Rohit Talluri is a Generative AI GTM Specialist (Tech BD) at Amazon Web Services (AWS). He is partnering with key GenAI foundation model providers, AWS service teams, strategic customers, founders, universities, venture ecosystems, and Amazon to develop technology strategy that enables the next generation of artificial intelligence, machine learning, and accelerated computing on AWS.
 Anoop Saha is a Sr GTM Specialist at Amazon Web Services (AWS) focusing on Gen AI model training and inference. He is partnering with top foundation model builders, strategic customers, and AWS service teams to enable distributed training and inference at scale on AWS and lead joint GTM motions. Before AWS, Anoop has held several leadership roles at startups and large corporations, primarily focusing on silicon and system architecture of AI infrastructure.