Accelerating PyTorch with CUDA Graphs

Today, we are pleased to announce a new advanced CUDA feature, CUDA Graphs, has been brought to PyTorch. Modern DL frameworks have complicated software stacks that incur significant overheads associated with the submission of each operation to the GPU. When DL workloads are strong-scaled to many GPUs for performance, the time taken by each GPU operation diminishes to just a few microseconds and, in these cases, the high work submission latencies of frameworks often lead to low utilization of the GPU. As GPUs get faster and workloads are scaled to more devices, the likelihood of workloads suffering from these launch-induced stalls increases. To overcome these performance overheads, NVIDIA engineers worked with PyTorch developers to enable CUDA graph execution natively in PyTorch. This design was instrumental in scaling NVIDIA’s MLPerf workloads (implemented in PyTorch) to over 4000 GPUs in order to achieve record-breaking performance.

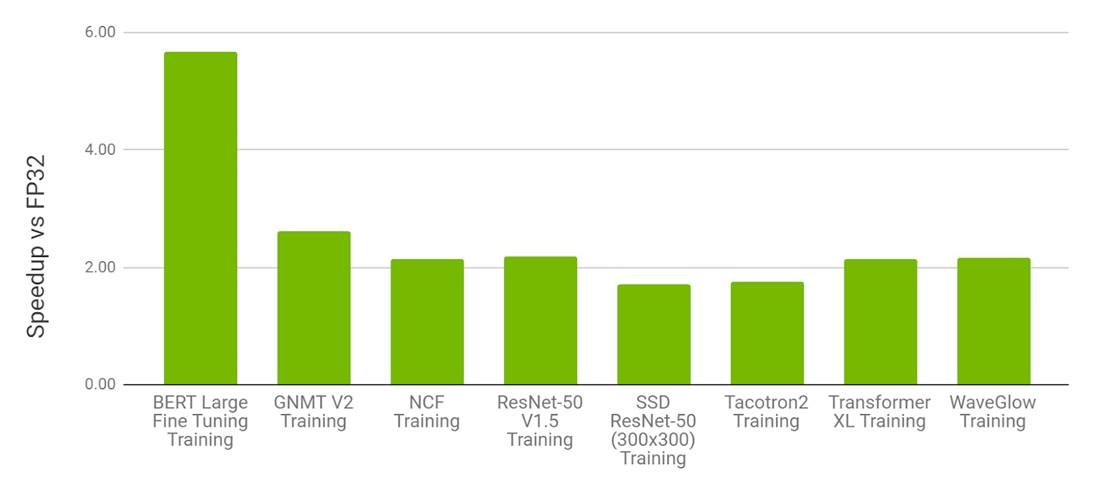
CUDA graphs support in PyTorch is just one more example of a long collaboration between NVIDIA and Facebook engineers. torch.cuda.amp, for example, trains with half precision while maintaining the network accuracy achieved with single precision and automatically utilizing tensor cores wherever possible. AMP delivers up to 3X higher performance than FP32 with just a few lines of code change. Similarly, NVIDIA’s Megatron-LM was trained using PyTorch on up to 3072 GPUs. In PyTorch, one of the most performant methods to scale-out GPU training is with torch.nn.parallel.DistributedDataParallel coupled with the NVIDIA Collective Communications Library (NCCL) backend.

CUDA Graphs

CUDA Graphs, which made its debut in CUDA 10, let a series of CUDA kernels to be defined and encapsulated as a single unit, i.e., a graph of operations, rather than a sequence of individually-launched operations. It provides a mechanism to launch multiple GPU operations through a single CPU operation, and hence reduces the launching overheads.

The benefits of CUDA graphs can be demonstrated with the simple example in Figure 1. On the top, a sequence of short kernels is launched one-by-one by the CPU. The CPU launching overhead creates a significant gap in between the kernels. If we replace this sequence of kernels with a CUDA graph, initially we will need to spend a little extra time on building the graph and launching the whole graph in one go on the first occasion, but subsequent executions will be very fast, as there will be very little gap between the kernels. The difference is more pronounced when the same sequence of operations is repeated many times, for example, overy many training steps. In that case, the initial costs of building and launching the graph will be amortized over the entire number of training iterations. For a more comprehensive introduction on the topic, see our blog
Getting Started with CUDA Graphs and GTC talk Effortless CUDA Graphs.

Cuda graphs reduce launching overhead by bundling multiple GPU operations into a single launchable unit, i.e., a graph. On the top, you can see five individual launches; whereas on the bottom, with CUDA graphs, they are all bundled into a single launch, reducing overhead.

Figure 1. Benefits of using CUDA graphs

NCCL support for CUDA graphs

The previously mentioned benefits of reducing launch overheads also extend to NCCL kernel launches. NCCL enables GPU-based collective and P2P communications. With NCCL support for CUDA graphs, we can eliminate the NCCL kernel launch overhead.

Additionally, kernel launch timing can be unpredictable due to various CPU load and operating system factors. Such time skews can be harmful to the performance of NCCL collective operations. With CUDA graphs, kernels are clustered together so that performance is consistent across ranks in a distributed workload. This is especially useful in large clusters where even a single slow node can bring down overall cluster level performance.

For distributed multi-GPU workloads, NCCL is used for collective communications. If we look at training a neural network that leverages data parallelism, without NCCL support for CUDA graphs, we’ll need a separate launch for each of forward/back propagation and NCCL AllReduce. By contrast, with NCCL support for CUDA graphs, we can reduce launch overhead by lumping together the forward/backward propagation and NCCL AllReduce all in a single graph launch.

With NCCL CUDA graph support, all the kernel launches for NCCL AllReduce for  the forward/backward propagation can be bundled into a graph to reduce overhead launch time.

Figure 2. Looking at a typical neural network, all the kernel launches for NCCL AllReduce can be bundled into a graph to reduce overhead launch time.

PyTorch CUDA Graphs

From PyTorch v1.10, the CUDA graphs functionality is made available as a set of beta APIs.

API overview

PyTorch supports the construction of CUDA graphs using stream capture, which puts a CUDA stream in capture mode. CUDA work issued to a capturing stream doesn’t actually run on the GPU. Instead, the work is recorded in a graph. After capture, the graph can be launched to run the GPU work as many times as needed. Each replay runs the same kernels with the same arguments. For pointer arguments this means the same memory addresses are used. By filling input memory with new data (e.g., from a new batch) before each replay, you can rerun the same work on new data.

Replaying a graph sacrifices the dynamic flexibility of typical eager execution in exchange for greatly reduced CPU overhead. A graph’s arguments and kernels are fixed, so a graph replay skips all layers of argument setup and kernel dispatch, including Python, C++, and CUDA driver overheads. Under the hood, a replay submits the entire graph’s work to the GPU with a single call to cudaGraphLaunch. Kernels in a replay also execute slightly faster on the GPU, but eliding CPU overhead is the main benefit.

You should try CUDA graphs if all or part of your network is graph-safe (usually this means static shapes and static control flow, but see the other constraints) and you suspect its runtime is at least somewhat CPU-limited.

API example

PyTorch exposes graphs via a raw torch.cuda.CUDAGraphclass and two convenience wrappers, torch.cuda.graph and torch.cuda.make_graphed_callables.

torch.cuda.graph

torch.cuda.graph is a simple, versatile context manager that captures CUDA work in its context. Before capture, warm up the workload to be captured by running a few eager iterations. Warmup must occur on a side stream. Because the graph reads from and writes to the same memory addresses in every replay, you must maintain long-lived references to tensors that hold input and output data during capture. To run the graph on new input data, copy new data to the capture’s input tensor(s), replay the graph, then read the new output from the capture’s output tensor(s).

If the entire network is capture safe, one can capture and replay the whole network as in the following example.

N, D_in, H, D_out = 640, 4096, 2048, 1024
model = torch.nn.Sequential(torch.nn.Linear(D_in, H),
                            torch.nn.Dropout(p=0.2),
                            torch.nn.Linear(H, D_out),
                            torch.nn.Dropout(p=0.1)).cuda()
loss_fn = torch.nn.MSELoss()
optimizer = torch.optim.SGD(model.parameters(), lr=0.1)

# Placeholders used for capture
static_input = torch.randn(N, D_in, device='cuda')
static_target = torch.randn(N, D_out, device='cuda')

# warmup
# Uses static_input and static_target here for convenience,
# but in a real setting, because the warmup includes optimizer.step()
# you must use a few batches of real data.
s = torch.cuda.Stream()
s.wait_stream(torch.cuda.current_stream())
with torch.cuda.stream(s):
    for i in range(3):
        optimizer.zero_grad(set_to_none=True)
        y_pred = model(static_input)
        loss = loss_fn(y_pred, static_target)
        loss.backward()
        optimizer.step()
torch.cuda.current_stream().wait_stream(s)

# capture
g = torch.cuda.CUDAGraph()
# Sets grads to None before capture, so backward() will create
# .grad attributes with allocations from the graph's private pool
optimizer.zero_grad(set_to_none=True)
with torch.cuda.graph(g):
    static_y_pred = model(static_input)
    # Fills the graph's input memory with new data to compute on
    static_input.copy_(data)
    static_target.copy_(target)
    # replay() includes forward, backward, and step.
    # You don't even need to call optimizer.zero_grad() between iterations
    # because the captured backward refills static .grad tensors in place.
    g.replay()
    # Params have been updated. static_y_pred, static_loss, and .grad
    # attributes hold values from computing on this iteration's data.

If some of your network is unsafe to capture (e.g., due to dynamic control flow, dynamic shapes, CPU syncs, or essential CPU-side logic), you can run the unsafe part(s) eagerly and use torch.cuda.make_graphed_callables() to graph only the capture-safe part(s). This is demonstrated next.

torch.cuda.make_graphed_callables

make_graphed_callables accepts callables (functions or nn.Module and returns graphed versions. By default, callables returned by make_graphed_callables() are autograd-aware, and can be used in the training loop as direct replacements for the functions or nn.Module you passed. make_graphed_callables() internally creates CUDAGraph objects, runs warm up iterations, and maintains static inputs and outputs as needed. Therefore, (unlike with torch.cuda.graph) you don’t need to handle those manually.

In the following example, data-dependent dynamic control flow means the network isn’t capturable end-to-end, but make_graphed_callables() lets us capture and run graph-safe sections as graphs regardless:

N, D_in, H, D_out = 640, 4096, 2048, 1024

module1 = torch.nn.Linear(D_in, H).cuda()
module2 = torch.nn.Linear(H, D_out).cuda()
module3 = torch.nn.Linear(H, D_out).cuda()

loss_fn = torch.nn.MSELoss()
optimizer = torch.optim.SGD(chain(module1.parameters() +
                                  module2.parameters() +
                                  module3.parameters()),
                            lr=0.1)

# Sample inputs used for capture
# requires_grad state of sample inputs must match
# requires_grad state of real inputs each callable will see.
x = torch.randn(N, D_in, device='cuda')
h = torch.randn(N, H, device='cuda', requires_grad=True)

module1 = torch.cuda.make_graphed_callables(module1, (x,))
module2 = torch.cuda.make_graphed_callables(module2, (h,))
module3 = torch.cuda.make_graphed_callables(module3, (h,))

real_inputs = [torch.rand_like(x) for _ in range(10)]
real_targets = [torch.randn(N, D_out, device="cuda") for _ in range(10)]

for data, target in zip(real_inputs, real_targets):
    optimizer.zero_grad(set_to_none=True)

    tmp = module1(data)  # forward ops run as a graph

    if tmp.sum().item() > 0:
        tmp = module2(tmp)  # forward ops run as a graph
    else:
        tmp = module3(tmp)  # forward ops run as a graph

    loss = loss_fn(tmp, y)
    # module2's or module3's (whichever was chosen) backward ops,
    # as well as module1's backward ops, run as graphs
    loss.backward()
    optimizer.step()

Example use cases

MLPerf v1.0 training workloads

The PyTorch CUDA graphs functionality was instrumental in scaling NVIDIA’s MLPerf training v1.0 workloads (implemented in PyTorch) to over 4000 GPUs, setting new records across the board. We illustrate below two MLPerf workloads where the most significant gains were observed with the use of CUDA graphs, yielding up to ~1.7x speedup.

  Number of GPUs Speedup from CUDA-graphs
Mask R-CNN 272 1.70×
BERT 4096 1.12×

Table 1. MLPerf training v1.0 performance improvement with PyTorch CUDA graph.

Mask R-CNN

Deep learning frameworks use GPUs to accelerate computations, but a significant amount of code still runs on CPU cores. CPU cores process meta-data like tensor shapes in order to prepare arguments needed to launch GPU kernels. Processing meta-data is a fixed cost while the cost of the computational work done by the GPUs is positively correlated with batch size. For large batch sizes, CPU overhead is a negligible percentage of total run time cost, but at small batch sizes CPU overhead can become larger than GPU run time. When that happens, GPUs go idle between kernel calls. This issue can be identified on an NSight timeline plot in Figure 3. The plot below shows the “backbone” portion of Mask R-CNN with per-gpu batch size of 1 before graphing. The green portion shows CPU load while the blue portion shows GPU load. In this profile we see that the CPU is maxed out at 100% load while GPU is idle most of the time, there is a lot of empty space between GPU kernels.

NSight timeline plot of Mask R-CNN shows that the CPU is maxed out at 100% load while GPU is idle most of the time, and a lot of empty space between GPU kernels

Figure 3: NSight timeline plot of Mask R-CNN

CUDA graphs can automatically eliminate CPU overhead when tensor shapes are static. A complete graph of all the kernel calls is captured during the first step, in subsequent steps the entire graph is launched with a single op, eliminating all the CPU overhead, as observed in Figure 4..

With CUDA graph, the entire graph is launched with a single op, eliminating all the CPU overhead

Figure 4: CUDA graphs optimization

With graphing, we see that the GPU kernels are tightly packed and GPU utilization remains high. The graphed portion now runs in 6 ms instead of 31ms, a speedup of 5x. We did not graph the entire model, mostly just the resnet backbone, which resulted in an overall speedup of ~1.7x.
In order to increase the scope of the graph, we made some changes in the software stack to eliminate some of the CPU-GPU synchronization points. In MLPerf v1.0, this work included changing the implementation of torch.randperm function to use CUB instead of Thrust because the latter is a synchronous C++ template library. These improvements are available in the latest NGC container.

BERT

Similarly, by graph capturing the model, we eliminate CPU overhead and accompanying synchronization overhead. CUDA graphs implementation results in a 1.12x performance boost for our max-scale BERT configuration. To maximize the benefits from CUDA graphs, it is important to keep the scope of the graph as large as possible. To achieve this, we modified the model script to remove CPU-GPU synchronizations during the execution such that the full model can be graph captured. Furthermore, we also made sure that the tensor sizes during the execution are static within the scope of the graph. For instance, in BERT, only a specific subset of total tokens contribute to loss function, determined by a pre-generated mask tensor. Extracting the indices of valid tokens from this mask, and using these indices to gather the tokens that contribute to the loss, results in a tensor with a dynamic shape, i.e. with shape that is not constant across iterations. In order to make sure tensor sizes are static, instead of using the dynamic-shape tensors in the loss computation, we used static shape tensors where a mask is used to indicate which elements are valid. As a result, all tensor shapes are static. Dynamic shapes also require CPU-GPU synchronization since it has to involve the framework’s memory management on the CPU side. With static-only shapes, no CPU-GPU synchronizations are necessary. This is shown in Figure 5.

Synchronization free training eliminates CPU synchronization

Figure 5. By using a fixed size tensor and a boolean mask as described in the text, we are able to eliminate CPU synchronizations needed for dynamic sized tensors

CUDA graphs in NVIDIA DL examples collection

Single GPU use cases can also benefit from using CUDA Graphs. This is particularly true for workloads launching many short kernels with small batches. A good example is training and inference for recommender systems. Below we present preliminary benchmark results for NVIDIA’s implementation of the Deep Learning Recommendation Model (DLRM) from our Deep Learning Examples collection. Using CUDA graphs for this workload provides significant speedups for both training and inference. The effect is particularly visible when using very small batch sizes, where CPU overheads are more pronounced.

CUDA graphs are being actively integrated into other PyTorch NGC model scripts and the NVIDIA Github deep learning examples. Stay tuned for more examples on how to use it.

CUDA graphs optimization for the DLRM model. The impact is larger for smaller batch sizes where CPU overheads are more pronounced.

CUDA graphs optimization for the DLRM model. The impact is larger for smaller batch sizes where CPU overheads are more pronounced.

Figure 6: CUDA graphs optimization for the DLRM model.

Call to action: CUDA Graphs in PyTorch v1.10

CUDA graphs can provide substantial benefits for workloads that comprise many small GPU kernels and hence bogged down by CPU launch overheads. This has been demonstrated in our MLPerf efforts, optimizing PyTorch models. Many of these optimizations, including CUDA graphs, have or will eventually be integrated into our PyTorch NGC model scripts collection and the NVIDIA Github deep learning examples. For now, check out our open-source MLPerf training v1.0 implementation which could serve as a good starting point to see CUDA graph in action. Alternatively, try the PyTorch CUDA graphs API on your own workloads.

We thank many NVIDIAN’s and Facebook engineers for their discussions and suggestions:
Karthik Mandakolathur US,
Tomasz Grel,
PLJoey Conway,
Arslan Zulfiqar US

Authors bios

Vinh Nguyen
DL Engineer, NVIDIA

Vinh is a Deep learning engineer and data scientist, having published more than 50 scientific articles attracting more than 2500 citations. At NVIDIA, his work spans a wide range of deep learning and AI applications, including speech, language and vision processing, and recommender systems.

Michael Carilli
Senior Developer Technology Engineer, NVIDIA

Michael worked at the Air Force Research Laboratory optimizing CFD code for modern parallel architectures. He holds a PhD in computational physics from the University of California, Santa Barbara. A member of the PyTorch team, he focuses on making GPU training fast, numerically stable, and easy(er) for internal teams, external customers, and Pytorch community users.

Sukru Burc Eryilmaz
Senior Architect in Dev Arch, NVIDIA

Sukru received his PhD from Stanford University, and B.S from Bilkent University. He currently works on improving the end-to-end performance of neural network training both at single-node scale and supercomputer scale.

Vartika Singh
Tech Partner Lead for DL Frameworks and Libraries, NVIDIA

Vartika has led teams working in confluence of cloud and distributed computing, scaling and AI, influencing the design and strategy of major corporations. She currently works with the major frameworks and compiler organizations and developers within and outside NVIDIA, to help the design to work efficiently and optimally on NVIDIA hardware.

Michelle Lin
Product Intern, NVIDIA

Michelle is currently pursuing an undergraduate degree in Computer Science and Business Administration at UC Berkeley. She is currently managing execution of projects such as conducting market research and creating marketing assets for Magnum IO.

Natalia Gimelshein
Applied Research Scientist, Facebook

Natalia Gimelshein worked on GPU performance optimization for deep learning workloads at NVIDIA and Facebook. She is currently a member of the PyTorch core team, working with partners to seamlessly support new software and hardware features.

Alban Desmaison
Research Engineer, Facebook

Alban studied engineering and did a PhD in Machine Learning and Optimization, during which he was an OSS contributor to PyTorch prior to joining Facebook. His main responsibilities are maintaining some core library and features (autograd, optim, nn) and working on making PyTorch better in general.

Edward Yang
Research Engineer, Facebook

Edward studied CS at MIT and then Stanford before starting at Facebook. He is a part of the PyTorch core team and is one of the leading contributors to PyTorch.

Read More
PyTorch 1.10 Release, including CUDA Graphs APIs, Frontend and Compiler Improvements

We are excited to announce the release of PyTorch 1.10. This release is composed of over 3,400 commits since 1.9, made by 426 contributors. We want to sincerely thank our community for continuously improving PyTorch.

PyTorch 1.10 updates are focused on improving training and performance of PyTorch, and developer usability. The full release notes are available here. Highlights include:

  1. CUDA Graphs APIs are integrated to reduce CPU overheads for CUDA workloads.
  2. Several frontend APIs such as FX, torch.special, and nn.Module Parametrization, have moved from beta to stable.
  3. Support for automatic fusion in JIT Compiler expands to CPUs in addition to GPUs.
  4. Android NNAPI support is now available in beta.

Along with 1.10, we are also releasing major updates to the PyTorch libraries, which you can read about in this blog post.

Frontend APIs

(Stable) Python code transformations with FX

FX provides a Pythonic platform for transforming and lowering PyTorch programs. It is a toolkit for pass writers to facilitate Python-to-Python transformation of functions and nn.Module instances. This toolkit aims to support a subset of Python language semantics—rather than the whole Python language—to facilitate ease of implementation of transforms. With 1.10, FX is moving to stable.

You can learn more about FX in the official documentation and GitHub examples of program transformations implemented using torch.fx.

(Stable) torch.special

A torch.special module, analogous to SciPy’s special module, is now available in stable. The module has 30 operations, including gamma, Bessel, and (Gauss) error functions.

Refer to this documentation for more details.

(Stable) nn.Module Parametrization

nn.Module parametrizaton, a feature that allows users to parametrize any parameter or buffer of an nn.Module without modifying the nn.Module itself, is available in stable. This release adds weight normalization (weight_norm), orthogonal parametrization (matrix constraints and part of pruning) and more flexibility when creating your own parametrization.

Refer to this tutorial and the general documentation for more details.

(Beta) CUDA Graphs APIs Integration

PyTorch now integrates CUDA Graphs APIs to reduce CPU overheads for CUDA workloads.

CUDA Graphs greatly reduce the CPU overhead for CPU-bound cuda workloads and thus improve performance by increasing GPU utilization. For distributed workloads, CUDA Graphs also reduce jitter, and since parallel workloads have to wait for the slowest worker, reducing jitter improves overall parallel efficiency.

Integration allows seamless interop between the parts of the network captured by cuda graphs, and parts of the network that cannot be captured due to graph limitations.

Read the note for more details and examples, and refer to the general documentation for additional information.

[Beta] Conjugate View

PyTorch’s conjugation for complex tensors (torch.conj()) is now a constant time operation, and returns a view of the input tensor with a conjugate bit set as can be seen by calling torch.is_conj() . This has already been leveraged in various other PyTorch operations like matrix multiplication, dot product etc., to fuse conjugation with the operation leading to significant performance gain and memory savings on both CPU and CUDA.

Distributed Training

Distributed Training Releases Now in Stable

In 1.10, there are a number of features that are moving from beta to stable in the distributed package:

  • (Stable) Remote Module: This feature allows users to operate a module on a remote worker like using a local module, where the RPCs are transparent to the user. Refer to this documentation for more details.
  • (Stable) DDP Communication Hook: This feature allows users to override how DDP synchronizes gradients across processes. Refer to this documentation for more details.
  • (Stable) ZeroRedundancyOptimizer: This feature can be used in conjunction with DistributedDataParallel to reduce the size of per-process optimizer states. With this stable release, it now can handle uneven inputs to different data-parallel workers. Check out this tutorial. We also improved the parameter partition algorithm to better balance memory and computation overhead across processes. Refer to this documentation and this tutorial to learn more.

Performance Optimization and Tooling

[Beta] Profile-directed typing in TorchScript

TorchScript has a hard requirement for source code to have type annotations in order for compilation to be successful. For a long time, it was only possible to add missing or incorrect type annotations through trial and error (i.e., by fixing the type-checking errors generated by torch.jit.script one by one), which was inefficient and time consuming.

Now, we have enabled profile directed typing for torch.jit.script by leveraging existing tools like MonkeyType, which makes the process much easier, faster, and more efficient. For more details, refer to the documentation.

(Beta) CPU Fusion

In PyTorch 1.10, we’ve added an LLVM-based JIT compiler for CPUs that can fuse together sequences of torch library calls to improve performance. While we’ve had this capability for some time on GPUs, this release is the first time we’ve brought compilation to the CPU.
You can check out a few performance results for yourself in this Colab notebook.

(Beta) PyTorch Profiler

The objective of PyTorch Profiler is to target the execution steps that are the most costly in time and/or memory, and visualize the workload distribution between GPUs and CPUs. PyTorch 1.10 includes the following key features:

  • Enhanced Memory View: This helps you understand your memory usage better. This tool will help you avoid Out of Memory errors by showing active memory allocations at various points of your program run.
  • Enhanced Automated Recommendations: This helps provide automated performance recommendations to help optimize your model. The tools recommend changes to batch size, TensorCore, memory reduction technologies, etc.
  • Enhanced Kernel View: Additional columns show grid and block sizes as well as shared memory usage and registers per thread.
  • Distributed Training: Gloo is now supported for distributed training jobs.
  • Correlate Operators in the Forward & Backward Pass: This helps map the operators found in the forward pass to the backward pass, and vice versa, in a trace view.
  • TensorCore: This tool shows the Tensor Core (TC) usage and provides recommendations for data scientists and framework developers.
  • NVTX: Support for NVTX markers was ported from the legacy autograd profiler.
  • Support for profiling on mobile devices: The PyTorch profiler now has better integration with TorchScript and mobile backends, enabling trace collection for mobile workloads.

Refer to this documentation for details. Check out this tutorial to learn how to get started with this feature.

PyTorch Mobile

(Beta) Android NNAPI Support in Beta

Last year we released prototype support for Android’s Neural Networks API (NNAPI). NNAPI allows Android apps to run computationally intensive neural networks on the most powerful and efficient parts of the chips that power mobile phones, including GPUs (Graphics Processing Units) and NPUs (specialized Neural Processing Units).

Since the prototype we’ve added more op coverage, added support for load-time flexible shapes and ability to run the model on the host for testing. Try out this feature using the tutorial.

Additionally, Transfer Learning steps have been added to Object Detection examples. Check out this GitHub page to learn more. Please provide your feedback or ask questions on the forum. You can also check out this presentation to get an overview.

Thanks for reading. If you’re interested in these updates and want to join the PyTorch community, we encourage you to join the discussion forums and open GitHub issues. To get the latest news from PyTorch, follow us on Twitter, Medium, YouTube, and LinkedIn.

Cheers!
Team PyTorch

Read More
New Library Releases in PyTorch 1.10, including TorchX, TorchAudio, TorchVision

Today, we are announcing a number of new features and improvements to PyTorch libraries, alongside the PyTorch 1.10 release. Some highlights include:

Some highlights include:

  • TorchX – a new SDK for quickly building and deploying ML applications from research & development to production.
  • TorchAudio – Added text-to-speech pipeline, self-supervised model support, multi-channel support and MVDR beamforming module, RNN transducer (RNNT) loss function, and batch and filterbank support to lfilter function. See the TorchAudio release notes here.
  • TorchVision – Added new RegNet and EfficientNet models, FX based feature extraction added to utilities, two new Automatic Augmentation techniques: Rand Augment and Trivial Augment, and updated training recipes. See the TorchVision release notes here.

Introducing TorchX

TorchX is a new SDK for quickly building and deploying ML applications from research & development to production. It offers various builtin components that encode MLOps best practices and make advanced features like distributed training and hyperparameter optimization accessible to all.

Users can get started with TorchX 0.1 with no added setup cost since it supports popular ML schedulers and pipeline orchestrators that are already widely adopted and deployed in production. No two production environments are the same. To comply with various use cases, TorchX’s core APIs allow tons of customization at well-defined extension points so that even the most unique applications can be serviced without customizing the whole vertical stack.

Read the documentation for more details and try out this feature using this quickstart tutorial.

TorchAudio 0.10

[Beta] Text-to-speech pipeline

TorchAudio now adds the Tacotron2 model and pretrained weights. It is now possible to build a text-to-speech pipeline with existing vocoder implementations like WaveRNN and Griffin-Lim. Building a TTS pipeline requires matching data processing and pretrained weights, which are often non-trivial to users. So TorchAudio introduces a bundle API so that constructing pipelines for specific pretrained weights is easy. The following example illustrates this.

>>> import torchaudio
>>>
>>> bundle = torchaudio.pipelines.TACOTRON2_WAVERNN_CHAR_LJSPEECH
>>>
>>> # Build text processor, Tacotron2 and vocoder (WaveRNN) model
>>> processor = bundle.get_text_processor()
>>> tacotron2 = bundle.get_tacotron2()
Downloading:
100%|███████████████████████████████| 107M/107M [00:01<00:00, 87.9MB/s]
>>> vocoder = bundle.get_vocoder()
Downloading:
100%|███████████████████████████████| 16.7M/16.7M [00:00<00:00, 78.1MB/s]
>>>
>>> text = "Hello World!"
>>>
>>> # Encode text
>>> input, lengths = processor(text)
>>>
>>> # Generate (mel-scale) spectrogram
>>> specgram, lengths, _ = tacotron2.infer(input, lengths)
>>>
>>> # Convert spectrogram to waveform
>>> waveforms, lengths = vocoder(specgram, lengths)
>>>
>>> # Save audio
>>> torchaudio.save('hello-world.wav', waveforms, vocoder.sample_rate)

For the details of this API please refer to the documentation. You can also try this from the tutorial.

(Beta) Self-Supervised Model Support

TorchAudio added HuBERT model architecture and pre-trained weight support for wav2vec 2.0 and HuBERT. HuBERT and wav2vec 2.0 are novel ways for audio representation learning and they yield high accuracy when fine-tuned on downstream tasks. These models can serve as baseline in future research, therefore, TorchAudio is providing a simple way to run the model. Similar to the TTS pipeline, the pretrained weights and associated information, such as expected sample rates and output class labels (for fine-tuned weights) are put together as a bundle, so that they can be used to build pipelines. The following example illustrates this.

>>> import torchaudio
>>>
>>> bundle = torchaudio.pipelines.HUBERT_ASR_LARGE
>>>
>>> # Build the model and load pretrained weight.
>>> model = bundle.get_model()
Downloading:
100%|███████████████████████████████| 1.18G/1.18G [00:17<00:00, 73.8MB/s]
>>> # Check the corresponding labels of the output.
>>> labels = bundle.get_labels()
>>> print(labels)
('<s>', '<pad>', '</s>', '<unk>', '|', 'E', 'T', 'A', 'O', 'N', 'I', 'H', 'S', 'R', 'D', 'L', 'U', 'M', 'W', 'C', 'F', 'G', 'Y', 'P', 'B', 'V', 'K', "'", 'X', 'J', 'Q', 'Z')
>>>
>>> # Infer the label probability distribution
>>> waveform, sample_rate = torchaudio.load(hello-world.wav')
>>>
>>> emissions, _ = model(waveform)
>>>
>>> # Pass emission to (hypothetical) decoder
>>> transcripts = ctc_decode(emissions, labels)
>>> print(transcripts[0])
HELLO WORLD

Please refer to the documentation for more details and try out this feature using this tutorial.

(Beta) Multi-channel support and MVDR beamforming

Far-field speech recognition is a more challenging task compared to near-field recognition. Multi-channel methods such as beamforming help reduce the noises and enhance the target speech.

TorchAudio now adds support for differentiable Minimum Variance Distortionless Response (MVDR) beamforming on multi-channel audio using Time-Frequency masks. Researchers can easily assemble it with any multi-channel ASR pipeline. There are three solutions (ref_channel, stv_evd, stv_power) and it supports single-channel and multi-channel (perform average in the method) masks. It provides an online option that recursively updates the parameters for streaming audio. We also provide a tutorial on how to apply MVDR beamforming to the multi-channel audio in the example directory.

>>> from torchaudio.transforms import MVDR, Spectrogram, InverseSpectrogram
>>>
>>> # Load the multi-channel noisy audio
>>> waveform_mix, sr = torchaudio.load('mix.wav')
>>> # Initialize the stft and istft modules
>>> stft = Spectrogram(n_fft=1024, hop_length=256, return_complex=True, power=None)
>>> istft = InverseSpectrogram(n_fft=1024, hop_length=256)
>>> # Get the noisy spectrogram
>>> specgram_mix = stft(waveform_mix)
>>> # Get the Time-Frequency mask via machine learning models
>>> mask = model(waveform)
>>> # Initialize the MVDR module 
>>> mvdr = MVDR(ref_channel=0, solution=ref_channel, multi_mask=False)
>>> # Apply MVDR beamforming
>>> specgram_enhanced = mvdr(specgram_mix, mask)
>>> # Get the enhanced waveform via iSTFT
>>> waveform_enhanced = istft(specgram_enhanced, length=waveform.shape[-1])

Please refer to the documentation for more details and try out this feature using the MVDR tutorial.

(Beta) RNN Transducer Loss

The RNN transducer (RNNT) loss is part of the RNN transducer pipeline, which is a popular architecture for speech recognition tasks. Recently it has gotten attention for being used in a streaming setting, and has also achieved state-of-the-art WER for the LibriSpeech benchmark.

TorchAudio’s loss function supports float16 and float32 logits, has autograd and torchscript support, and can be run on both CPU and GPU, which has a custom CUDA kernel implementation for improved performance. The implementation is consistent with the original loss function in Sequence Transduction with Recurrent Neural Networks, but relies on code from Alignment Restricted Streaming Recurrent Neural Network Transducer. Special thanks to Jay Mahadeokar and Ching-Feng Yeh for their code contributions and guidance.

Please refer to the documentation for more details.

(Beta) Batch support and filter bank support

torchaudio.functional.lfilter now supports batch processing and multiple filters.

(Prototype) Emformer Module

Automatic speech recognition (ASR) research and productization have increasingly focused on on-device applications. Towards supporting such efforts, TorchAudio now includes Emformer, a memory-efficient transformer architecture that has achieved state-of-the-art results on LibriSpeech in low-latency streaming scenarios, as a prototype feature.

Please refer to the documentation for more details.

GPU Build

GPU builds that support custom CUDA kernels in TorchAudio, like the one being used for RNN transducer loss, have been added. Following this change, TorchAudio’s binary distribution now includes CPU-only versions and CUDA-enabled versions. To use CUDA-enabled binaries, PyTorch also needs to be compatible with CUDA.

TorchVision 0.11

(Stable) New Models

RegNet and EfficientNet are two popular architectures that can be scaled to different computational budgets. In this release we include 22 pre-trained weights for their classification variants. The models were trained on ImageNet and the accuracies of the pre-trained models obtained on ImageNet val can be found below (see #4403, #4530 and #4293 for more details).

The models can be used as follows:

import torch
from torchvision import models

x = torch.rand(1, 3, 224, 224)

regnet = models.regnet_y_400mf(pretrained=True)
regnet.eval()
predictions = regnet(x)

efficientnet = models.efficientnet_b0(pretrained=True)
efficientnet.eval()
predictions = efficientnet(x)

See the full list of new models on the torchvision.models documentation page.

We would like to thank Ross Wightman and Luke Melas-Kyriazi for contributing the weights of the EfficientNet variants.

(Beta) FX-based Feature Extraction

A new Feature Extraction method has been added to our utilities. It uses torch.fx and enables us to retrieve the outputs of intermediate layers of a network which is useful for feature extraction and visualization.

Here is an example of how to use the new utility:

import torch
from torchvision.models import resnet50
from torchvision.models.feature_extraction import create_feature_extractor


x = torch.rand(1, 3, 224, 224)

model = resnet50()

return_nodes = {
"layer4.2.relu_2": "layer4"
}
model2 = create_feature_extractor(model, return_nodes=return_nodes)
intermediate_outputs = model2(x)

print(intermediate_outputs['layer4'].shape)

We would like to thank Alexander Soare for developing this utility.

(Stable) New Data Augmentations

Two new Automatic Augmentation techniques were added: RandAugment and Trivial Augment. They apply a series of transformations on the original data to enhance them and to boost the performance of the models. The new techniques build on top of the previously added AutoAugment and focus on simplifying the approach, reducing the search space for the optimal policy and improving the performance gain in terms of accuracy. These techniques enable users to reproduce recipes to achieve state-of-the-art performance on the offered models. Additionally, it enables users to apply these techniques in order to do transfer learning and achieve optimal accuracy on new datasets.

Both methods can be used as drop-in replacement of the AutoAugment technique as seen below:

from torchvision import transforms

t = transforms.RandAugment()
# t = transforms.TrivialAugmentWide()
transformed = t(image)

transform = transforms.Compose([
transforms.Resize(256),
transforms.RandAugment(), # transforms.TrivialAugmentWide()
transforms.ToTensor()])

Read the automatic augmentation transforms for more details.

We would like to thank Samuel G. Müller for contributing to Trivial Augment and for his help on refactoring the AA package.

Updated Training Recipes

We have updated our training reference scripts to add support for Exponential Moving Average, Label Smoothing, Learning-Rate Warmup, Mixup, Cutmix and other SOTA primitives. The above enabled us to improve the classification Acc@1 of some pre-trained models by over 4 points. A major update of the existing pre-trained weights is expected in the next release.

Thanks for reading. If you’re interested in these updates and want to join the PyTorch community, we encourage you to join the discussion forums and open GitHub issues. To get the latest news from PyTorch, follow us on Twitter, Medium, YouTube and LinkedIn.

Cheers!
Team PyTorch

Read More
Announcing PyTorch Annual Hackathon 2021

We’re excited to announce the PyTorch Annual Hackathon 2021! This year, we’re looking to support the community in creating innovative PyTorch tools, libraries, and applications. 2021 is the third year we’re hosting this Hackathon, and we welcome you to join the PyTorch community and put your machine learning skills into action. Submissions start on September 8 and end on November 3. Good luck to everyone!

Submission Categories

You can enter your PyTorch projects into three categories:

  • PyTorch Responsible AI Development Tools & Libraries – Build an AI development tool or library that helps develop AI models and applications responsibly. These tools, libraries, and apps need to support a researcher or developer to factor in fairness, security, and privacy throughout the entire machine learning development process of data gathering, model training, model validation, inferences, monitoring, and more.

  • Web and Mobile Applications Powered by PyTorch – Build an application with the web, mobile interface, and/or embedded device powered by PyTorch so the end users can interact with it. The submission must be built on PyTorch or use PyTorch-based libraries such as torchvision, torchtext, and fast.ai.

  • PyTorch Developer Tools & Libraries – Build a creative, useful, and well-implemented tool or library for improving the productivity and efficiency of PyTorch researchers and developers. The submission must be a machine learning algorithm, model, or application built using PyTorch or PyTorch-based libraries.

Prizes

Submissions will be judged on the idea’s quality, originality, implementation, and potential impact.

  • First-Place Winners in each category of the Hackathon will receive $5,000 in cash, along with a 30-minute call with the PyTorch development team.

  • Second-Place Winners will receive $3,000.

  • Third-Place Winners will receive $2,000.

All winners will also receive the opportunity to create blog posts that will be featured throughout PyTorch channels as well as an exclusive Github badge. Honorable Mentions will also be awarded to the following three highest-scoring entries in each category and will receive $1,000 each.

Cloud Computing Credits

Request $100 in credits from Amazon Web Services or Google Cloud for your computing costs. Please allow 3 business days for your request to be reviewed. Credits will be provided to verified registrants until the supplies run out. For more information, see https://pytorch2021.devpost.com/details/sponsors.

2020 Winning Projects

DeMask won first place in the PyTorch Developer Tools category. Built using Asteroid, a PyTorch-based audio source separation toolkit, DeMask is an end-to-end model for enhancing speech while wearing face masks.

Q&Aid won first place in the Web/Mobile Applications Powered by PyTorch category. Backed by PyTorch core algorithms and models, Q&Aid is a conceptual health care chatbot aimed at making health care diagnoses and facilitating communication between patients and doctors.

FairTorch won first place in the PyTorch Responsible AI Development Tools category. FairTorch is a PyTorch fairness library that lets developers add constraints to their models to equalize metrics across subgroups by simply adding a few lines of code.

How to Join

If you’re interested in joining this year’s PyTorch Hackathon, register at http://pytorch2021.devpost.com.

Read More
How Computational Graphs are Constructed in PyTorch

In the previous post we went over the theoretical foundations of automatic differentiation and reviewed the implementation in PyTorch. In this post, we will be showing the parts of PyTorch involved in creating the graph and executing it. In order to understand the following contents, please read @ezyang’s wonderful blog post about PyTorch internals.

Autograd components

First of all, let’s look at where the different components of autograd live:

tools/autograd: Here we can find the definition of the derivatives as we saw in the previous post derivatives.yaml, several python scripts and a folder called templates. These scripts and the templates are used at building time to generate the C++ code for the derivatives as specified in the yaml file. Also, the scripts here generate wrappers for the regular ATen functions so that the computational graph can be constructed.

torch/autograd: This folder is where the autograd components that can be used directly from python are located. In function.py we find the actual definition of torch.autograd.Function, a class used by users to write their own differentiable functions in python as per the documentation. functional.py holds components for functionally computing the jacobian vector product, hessian, and other gradient related computations of a given function.
The rest of the files have additional components such as gradient checkers, anomaly detection, and the autograd profiler.

torch/csrc/autograd: This is where the graph creation and execution-related code lives.
All this code is written in C++, since it is a critical part that is required to be extremely performant. Here we have several files that implement the engine, metadata storage, and all the needed components. Alongside this, we have several files whose names start with python_, and their main responsibility is to allow python objects to be used in the autograd engine.

Graph Creation

Previously, we described the creation of a computational graph. Now, we will see how PyTorch creates these graphs with references to the actual codebase.


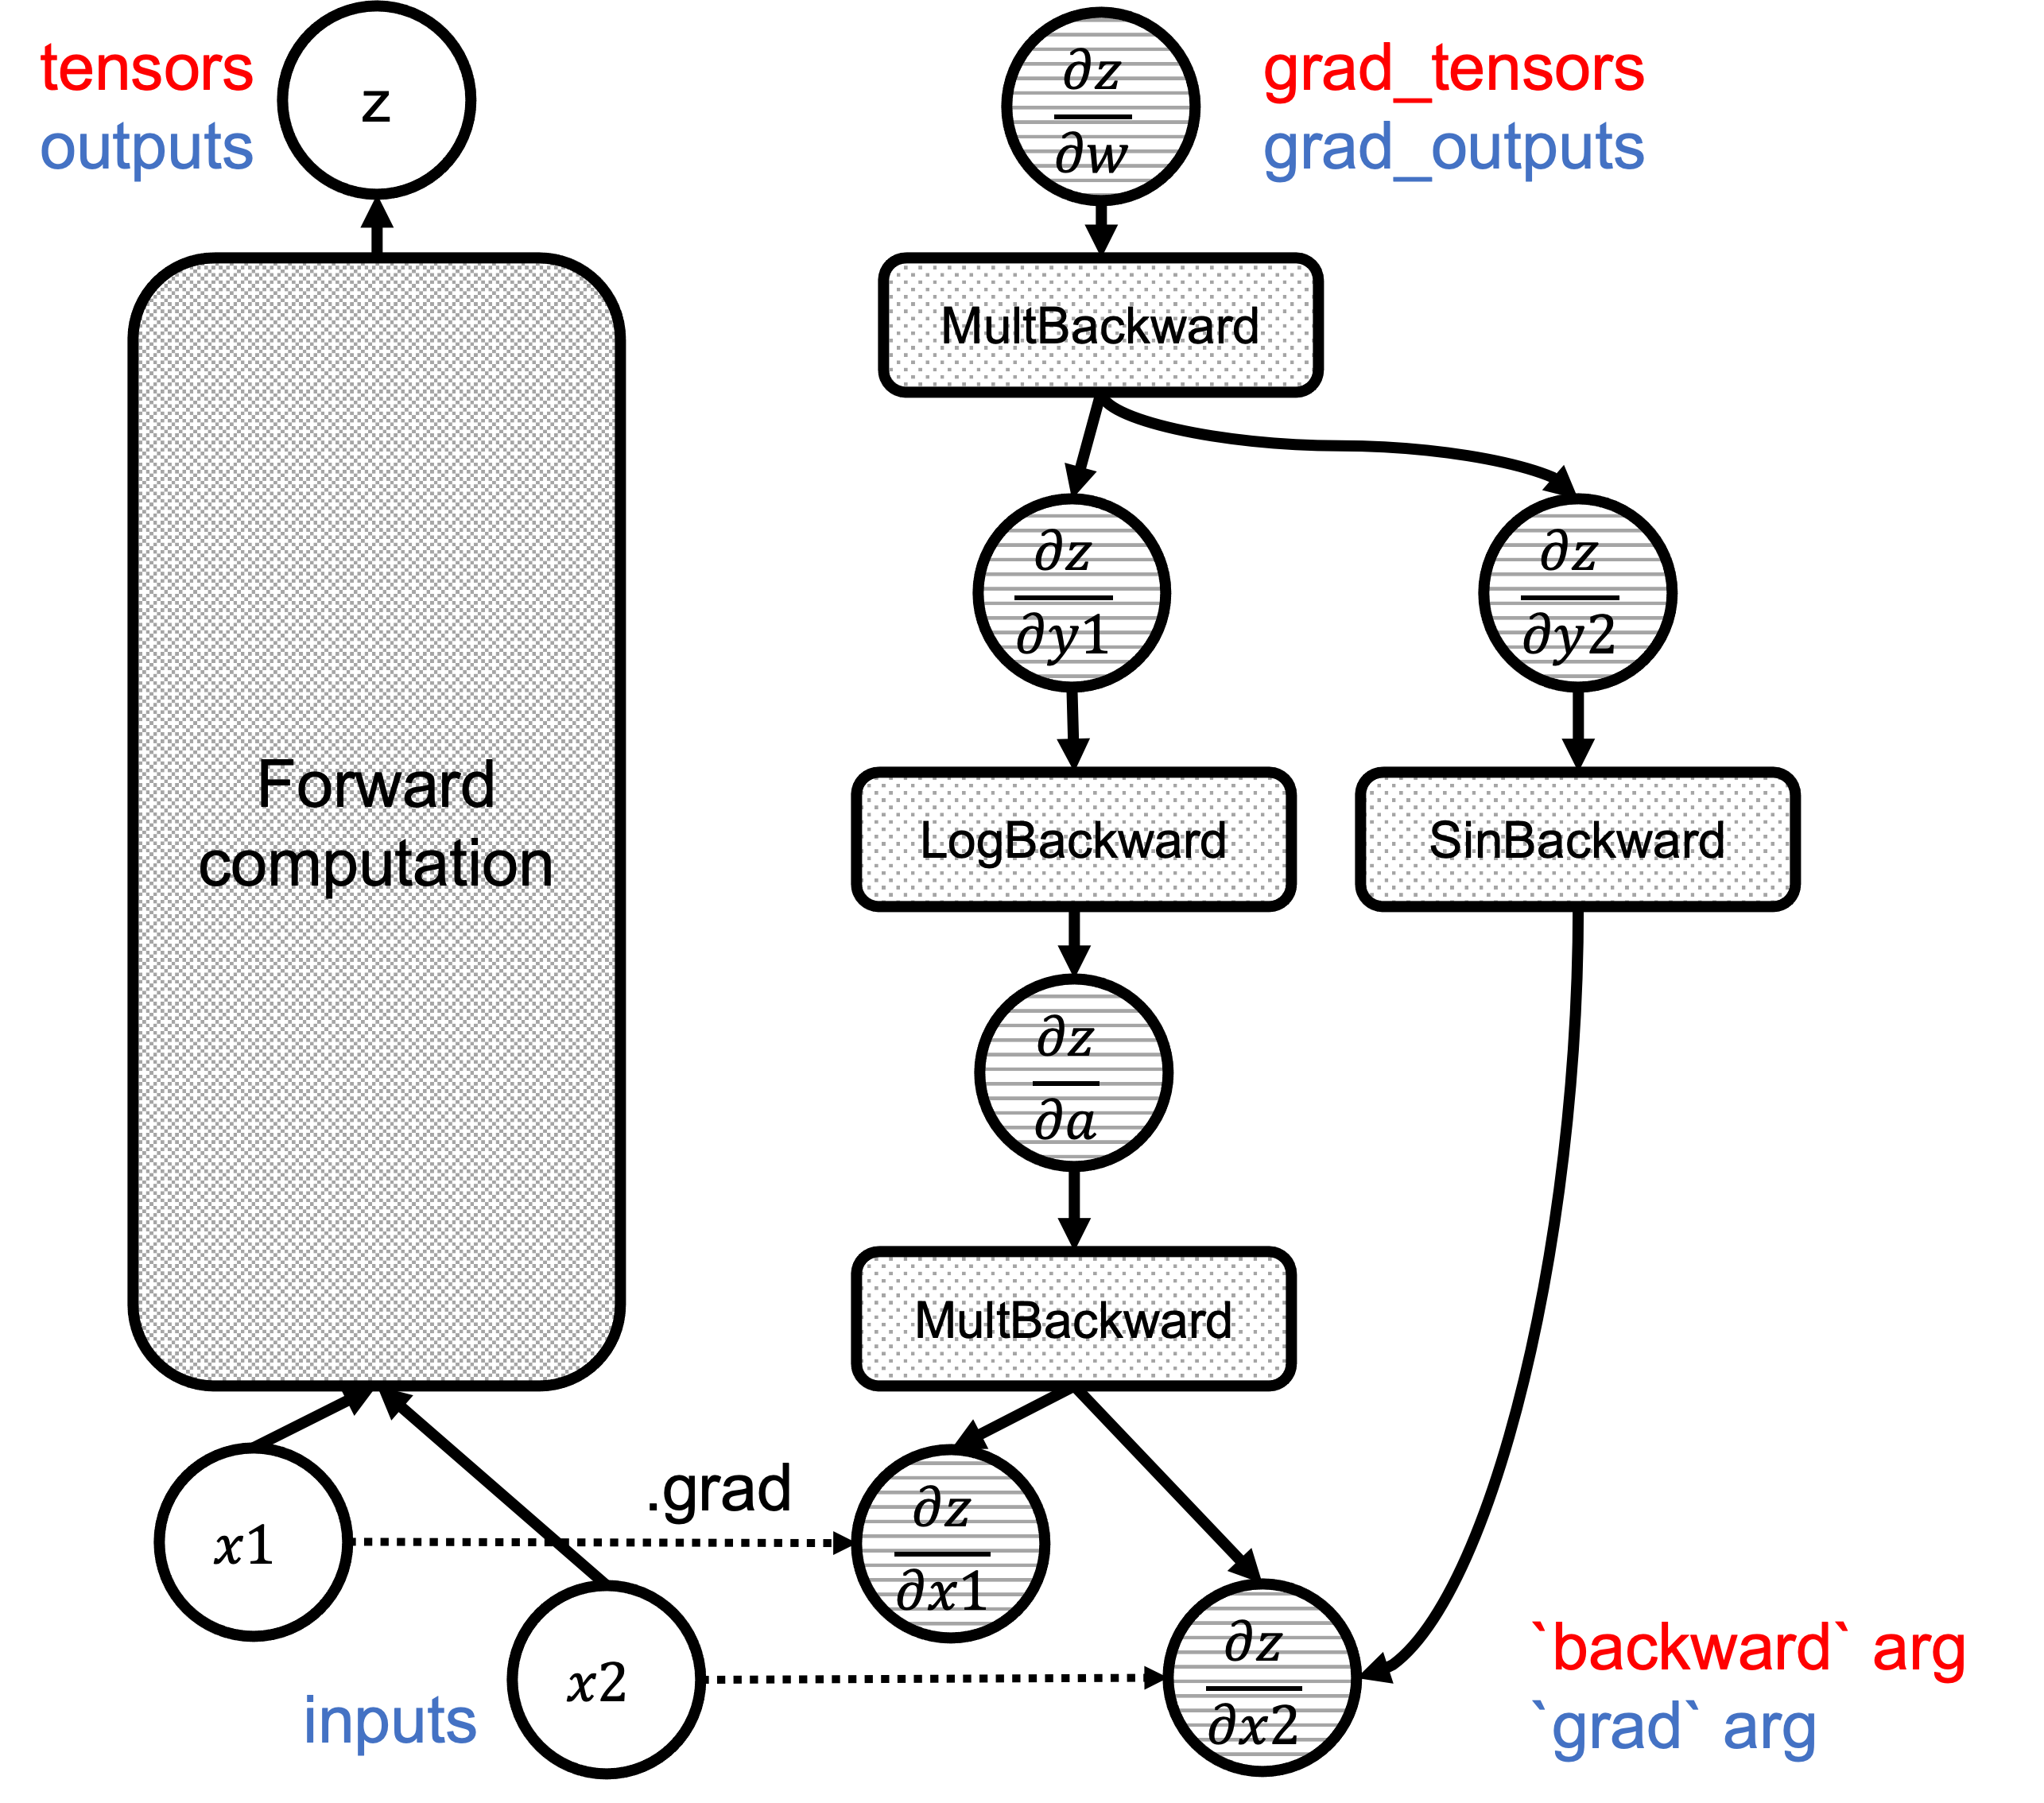
Figure 1: Example of an augmented computational graph

It all starts when in our python code, where we request a tensor to require the gradient.

>>> x = torch.tensor([0.5, 0.75], requires_grad=True)

When the required_grad flag is set in tensor creation, c10 will allocate an AutogradMeta object that is used to hold the graph information.


void TensorImpl::set_requires_grad(bool requires_grad) {
  ...
  if (!autograd_meta_)
    autograd_meta_ = impl::GetAutogradMetaFactory()->make();
    autograd_meta_->set_requires_grad(requires_grad, this);
}

The AutogradMeta object is defined in torch/csrc/autograd/variable.h as follows:


struct TORCH_API AutogradMeta : public c10::AutogradMetaInterface {
  std::string name_;

  Variable grad_;
  std::shared_ptr<Node> grad_fn_;
  std::weak_ptr<Node> grad_accumulator_;
  // other fields and methods
  ...
};

The most important fields in this structure are the computed gradient in grad_ and a pointer to the function grad_fn that will be called by the engine to produce the actual gradient. Also, there is a gradient accumulator object that is used to add together all the different gradients where this tensor is involved as we will see in the graph execution.

Graphs, Nodes and Edges.

Now, when we call a differentiable function that takes this tensor as an argument, the associated metadata will be populated. Let’s suppose that we call a regular torch function that is implemented in ATen. Let it be the multiplication as in our previous blog post example. The resulting tensor has a field called grad_fn that is essentially a pointer to the function that will be used to compute the gradient of that operation.

>>> x = torch.tensor([0.5, 0.75], requires_grad=True)
>>> v = x[0] * x[1]
>>> v
tensor(0.3750, grad_fn=<MulBackward0>)

Here we see that the tensors’ grad_fn has a MulBackward0 value. This function is the same that was written in the derivatives.yaml file, and its C++ code was generated automatically by all the scripts in tools/autograd. It’s auto-generated source code can be seen in torch/csrc/autograd/generated/Functions.cpp.

variable_list MulBackward0::apply(variable_list&& grads) {
  std::lock_guard<std::mutex> lock(mutex_);

  IndexRangeGenerator gen;
  auto self_ix = gen.range(1);
  auto other_ix = gen.range(1);
  variable_list grad_inputs(gen.size());
  auto& grad = grads[0];
  auto self = self_.unpack();
  auto other = other_.unpack();
  bool any_grad_defined = any_variable_defined(grads);
  if (should_compute_output({ other_ix })) {
    auto grad_result = any_grad_defined ? (mul_tensor_backward(grad, self, other_scalar_type)) : Tensor();
    copy_range(grad_inputs, other_ix, grad_result);
  }
  if (should_compute_output({ self_ix })) {
    auto grad_result = any_grad_defined ? (mul_tensor_backward(grad, other, self_scalar_type)) : Tensor();
    copy_range(grad_inputs, self_ix, grad_result);
  }
  return grad_inputs;
}

The grad_fn objects inherit from the TraceableFunction class, a descendant of Node with just a property set to enable tracing for debugging and optimization purposes. A graph by definition has nodes and edges, so these functions are indeed the nodes of the computational graph that are linked together by using Edge objects to enable the graph traversal later on.

The Node definition can be found in the torch/csrc/autograd/function.h file.

struct TORCH_API Node : std::enable_shared_from_this<Node> {
 ...
 /// Evaluates the function on the given inputs and returns the result of the
  /// function call.
  variable_list operator()(variable_list&& inputs) {
  ...
  }

protected:
  /// Performs the `Node`'s actual operation.
  virtual variable_list apply(variable_list&& inputs) = 0;
  
  edge_list next_edges_;

Essentially we see that it has an override of the operator () that performs the call to the actual function, and a pure virtual function called apply. The automatically generated functions override this apply method as we saw in the MulBackward0 example above. Finally, the node also has a list of edges to enable graph connectivity.

The Edge object is used to link Nodes together and its implementation is straightforward.

struct Edge {
  ...
  /// The function this `Edge` points to.
  std::shared_ptr<Node> function;
  /// The identifier of a particular input to the function.
  uint32_t input_nr;
};

It only requires a function pointer (the actual grad_fn objects that the edges link together), and an input number that acts as an id for the edge.

Linking nodes together

When we invoke the product operation of two tensors, we enter into the realm of autogenerated code. All the scripts that we saw in tools/autograd fill a series of templates that wrap the differentiable functions in ATen. These functions have code to construct the backward graph during the forward pass.

The gen_variable_type.py script is in charge of writing all this wrapping code. This script is called from the tools/autograd/gen_autograd.py during the pytorch build process and it will output the automatically generated function wrappers to torch/csrc/autograd/generated/.

Let’s take a look at how the tensor multiplication generated function looks like. The code has been simplified, but it can be found in the torch/csrc/autograd/generated/VariableType_4.cpp file when compiling pytorch from source.

at::Tensor mul_Tensor(c10::DispatchKeySet ks, const at::Tensor & self, const at::Tensor & other) {
  ...
  auto _any_requires_grad = compute_requires_grad( self, other );
  std::shared_ptr<MulBackward0> grad_fn;
  if (_any_requires_grad) {
    // Creates the link to the actual grad_fn and links the graph for backward traversal
    grad_fn = std::shared_ptr<MulBackward0>(new MulBackward0(), deleteNode);
    grad_fn->set_next_edges(collect_next_edges( self, other ));
    ...
  }
  
  // Does the actual function call to ATen
  auto _tmp = ([&]() {
    at::AutoDispatchBelowADInplaceOrView guard;
    return at::redispatch::mul(ks & c10::after_autograd_keyset, self_, other_);
  })();

  auto result = std::move(_tmp);
    if (grad_fn) {
       // Connects the result to the graph
      set_history(flatten_tensor_args( result ), grad_fn);
  }
  ...
  return result;
}

Let’s walk through the most important lines of this code.
First of all, the grad_fn object is created with: ` grad_fn = std::shared_ptr(new MulBackward0(), deleteNode);`.

After the grad_fn object is created, the edges used to link the nodes together are created by using the grad_fn->set_next_edges(collect_next_edges( self, other )); calls.

struct MakeNextFunctionList : IterArgs<MakeNextFunctionList> {
  edge_list next_edges;
  using IterArgs<MakeNextFunctionList>::operator();
  void operator()(const Variable& variable) {
    if (variable.defined()) {
      next_edges.push_back(impl::gradient_edge(variable));
    } else {
      next_edges.emplace_back();
    }
  }
  void operator()(const c10::optional<Variable>& variable) {
    if (variable.has_value() && variable->defined()) {
      next_edges.push_back(impl::gradient_edge(*variable));
    } else {
      next_edges.emplace_back();
    }
  }
};

template <typename... Variables>
edge_list collect_next_edges(Variables&&... variables) {
  detail::MakeNextFunctionList make;
  make.apply(std::forward<Variables>(variables)...);
  return std::move(make.next_edges);
}

Given an input variable (it’s just a regular tensor), collect_next_edges
will create an Edge object by calling impl::gradient_edge

 Edge gradient_edge(const Variable& self) {
    // If grad_fn is null (as is the case for a leaf node), we instead
    // interpret the gradient function to be a gradient accumulator, which will
    // accumulate its inputs into the grad property of the variable. These
    // nodes get suppressed in some situations, see "suppress gradient
    // accumulation" below. Note that only variables which have `requires_grad =
    // True` can have gradient accumulators.
    if (const auto& gradient = self.grad_fn()) {
      return Edge(gradient, self.output_nr());
    } else {
      return Edge(grad_accumulator(self), 0);
    }
  }

To understand how edges work, let’s assume that an early executed function produced two output tensors, both with their grad_fn set, each tensor also has an output_nr property with the order in which they were returned. When creating the edges for the current grad_fn, an Edge object per input variable will be created. The edges will point to the variable’s grad_fn and will also track the output_nr to establish ids used when traversing the graph. In the case that the input variables are “leaf”, i.e. they were not produced by any differentiable function, they don’t have a grad_fn attribute set. A special function called a gradient accumulator is set by default as seen in the above code snippet.

After the edges are created, the grad_fn graph Node object that is being currently created will hold them using the set_next_edges function. This is what connects grad_fns together, producing the computational graph.

 void set_next_edges(edge_list&& next_edges) {
    next_edges_ = std::move(next_edges);
    for(const auto& next_edge : next_edges_) {
      update_topological_nr(next_edge);
    }
  }

Now, the forward pass of the function will execute, and after the execution set_history will connect the output tensors to the grad_fn Node.

inline void set_history(
    at::Tensor& variable,
    const std::shared_ptr<Node>& grad_fn) {
  AT_ASSERT(grad_fn);
  if (variable.defined()) {
    // If the codegen triggers this, you most likely want to add your newly added function
    // to the DONT_REQUIRE_DERIVATIVE list in tools/autograd/gen_variable_type.py
    TORCH_INTERNAL_ASSERT(isDifferentiableType(variable.scalar_type()));
    auto output_nr =
        grad_fn->add_input_metadata(variable);
    impl::set_gradient_edge(variable, {grad_fn, output_nr});
  } else {
    grad_fn->add_input_metadata(Node::undefined_input());
  }
}

set_history calls set_gradient_edge, which just copies the grad_fn and the output_nr to the AutogradMeta object that the tensor has.

 void set_gradient_edge(const Variable& self, Edge edge) {
    auto* meta = materialize_autograd_meta(self);
    meta->grad_fn_ = std::move(edge.function);
    meta->output_nr_ = edge.input_nr;
    // For views, make sure this new grad_fn_ is not overwritten unless it is necessary
    // in the VariableHooks::grad_fn below.
    // This logic is only relevant for custom autograd Functions for which multiple
    // operations can happen on a given Tensor before its gradient edge is set when
    // exiting the custom Function.
    auto diff_view_meta = get_view_autograd_meta(self);
    if (diff_view_meta && diff_view_meta->has_bw_view()) {
      diff_view_meta->set_attr_version(self._version());
    }
  }

This tensor now will be the input to another function and the above steps will be all repeated. Check the animation below to see how the graph is created.


Figure 2: Animation that shows the graph creation

Registering Python Functions in the graph

We have seen how autograd creates the graph for the functions included in ATen. However, when we define our differentiable functions in Python, they are also included in the graph!

An autograd python defined function looks like the following:

class Exp(torch.autograd.Function):
     @staticmethod
     def forward(ctx, i):
         result = i.exp()
         ctx.save_for_backward(result)
         return result

     @staticmethod
     def backward(ctx, grad_output):
         result, = ctx.saved_tensors
         return grad_output * result

# Call the function
Exp.apply(torch.tensor(0.5, requires_grad=True))
# Outputs: tensor(1.6487, grad_fn=<ExpBackward>)

In the above snippet autograd detected our python function when creating the graph. All of this is possible thanks to the Function class. Let’s take a look at what happens when we call apply.

apply is defined in the torch._C._FunctionBase class, but this class is not present in the python source. _FunctionBase is defined in C++ by using the python C API to hook C functions together into a single python class. We are looking for a function named THPFunction_apply.


PyObject *THPFunction_apply(PyObject *cls, PyObject *inputs)
{
  
  // Generates the graph node
  THPObjectPtr backward_cls(PyObject_GetAttrString(cls, "_backward_cls"));
  if (!backward_cls) return nullptr;
  THPObjectPtr ctx_obj(PyObject_CallFunctionObjArgs(backward_cls, nullptr));
  if (!ctx_obj) return nullptr;
  THPFunction* ctx = (THPFunction*)ctx_obj.get();

  auto cdata = std::shared_ptr<PyNode>(new PyNode(std::move(ctx_obj)), deleteNode);
  ctx->cdata = cdata;

  // Prepare inputs and allocate context (grad fn)
  // Unpack inputs will collect the edges
  auto info_pair = unpack_input<false>(inputs);
  UnpackedInput& unpacked_input = info_pair.first;
  InputFlags& input_info = info_pair.second;

   // Initialize backward function (and ctx)
  bool is_executable = input_info.is_executable;
  cdata->set_next_edges(std::move(input_info.next_edges));
  ctx->needs_input_grad = input_info.needs_input_grad.release();
  ctx->is_variable_input = std::move(input_info.is_variable_input);

  // Prepend ctx to input_tuple, in preparation for static method call
  auto num_args = PyTuple_GET_SIZE(inputs);
  THPObjectPtr ctx_input_tuple(PyTuple_New(num_args + 1));
  if (!ctx_input_tuple) return nullptr;
  Py_INCREF(ctx);
  PyTuple_SET_ITEM(ctx_input_tuple.get(), 0, (PyObject*)ctx);
  for (int i = 0; i < num_args; ++i) {
    PyObject *arg = PyTuple_GET_ITEM(unpacked_input.input_tuple.get(), i);
    Py_INCREF(arg);
    PyTuple_SET_ITEM(ctx_input_tuple.get(), i + 1, arg);
  }

  // Call forward
  THPObjectPtr tensor_outputs;
  {
    AutoGradMode grad_mode(false);
    THPObjectPtr forward_fn(PyObject_GetAttrString(cls, "forward"));
    if (!forward_fn) return nullptr;
    tensor_outputs = PyObject_CallObject(forward_fn, ctx_input_tuple);
    if (!tensor_outputs) return nullptr;
  }

  // Here is where the outputs gets the tensors tracked
  return process_outputs(cls, cdata, ctx, unpacked_input, inputs, std::move(tensor_outputs),
                         is_executable, node);
  END_HANDLE_TH_ERRORS
}

Although this code is hard to read at first due to all the python API calls, it essentially does the same thing as the auto-generated forward functions that we saw for ATen:

Create a grad_fn object.
Collect the edges to link the current grad_fn with the input tensors one.
Execute the function forward.
Assign the created grad_fn to the output tensors metadata.

The grad_fn object is created in:

  // Generates the graph node
  THPObjectPtr backward_cls(PyObject_GetAttrString(cls, "_backward_cls"));
  if (!backward_cls) return nullptr;
  THPObjectPtr ctx_obj(PyObject_CallFunctionObjArgs(backward_cls, nullptr));
  if (!ctx_obj) return nullptr;
  THPFunction* ctx = (THPFunction*)ctx_obj.get();

  auto cdata = std::shared_ptr<PyNode>(new PyNode(std::move(ctx_obj)), deleteNode);
  ctx->cdata = cdata;

Basically, it asks the python API to get a pointer to the Python object that can execute the user-written function. Then it wraps it into a PyNode object that is a specialized Node object that calls the python interpreter with the provided python function when apply is executed during the forward pass. Note that in the code cdata is the actual Node object that is part of the graph. ctx is the object that is passed to the python forward/backward functions and it is used to store autograd related information by both, the user’s function and PyTorch.

As in the regular C++ functions we also call collect_next_edges to track the inputs grad_fn objects, but this is done in unpack_input:

template<bool enforce_variables>
std::pair<UnpackedInput, InputFlags> unpack_input(PyObject *args) {
  ...
  flags.next_edges = (flags.is_executable ? collect_next_edges(unpacked.input_vars) : edge_list());
  return std::make_pair(std::move(unpacked), std::move(flags));
}

After this, the edges are assigned to the grad_fn by just doing cdata->set_next_edges(std::move(input_info.next_edges)); and the forward function is called through the python interpreter C API.

Once the output tensors are returned from the forward pass, they are processed and converted to variables inside the process_outputs function.

PyObject* process_outputs(PyObject *op_obj, const std::shared_ptr<PyNode>& cdata,
                          THPFunction* grad_fn, const UnpackedInput& unpacked,
                          PyObject *inputs, THPObjectPtr&& raw_output, bool is_executable,
                          torch::jit::Node* node) {
  ...
  _wrap_outputs(cdata, grad_fn, unpacked.input_vars, raw_output, outputs, is_executable);
  _trace_post_record(node, op_obj, unpacked.input_vars, outputs, is_inplace, unpack_output);
  if (is_executable) {
    _save_variables(cdata, grad_fn);
  } ...
  return outputs.release();
}

Here, _wrap_outputs is in charge of setting the forward outputs grad_fn to the newly created one. For this, it calls another _wrap_outputs function defined in a different file, so the process here gets a little confusing.

static void _wrap_outputs(const std::shared_ptr<PyNode>& cdata, THPFunction *self,
    const variable_list &input_vars, PyObject *raw_output, PyObject *outputs, bool is_executable)
{
  auto cdata_if_executable = is_executable ? cdata : nullptr;
 ...

  // Wrap only the tensor outputs.
  // This calls csrc/autograd/custom_function.cpp
  auto wrapped_outputs = _wrap_outputs(input_vars, non_differentiable, dirty_inputs, raw_output_vars, cdata_if_executable);
...
}

The called _wrap_outputs is the one in charge of setting the autograd metadata in the output tensors:

std::vector<c10::optional<Variable>> _wrap_outputs(const variable_list &input_vars,
  const std::unordered_set<at::TensorImpl*> &non_differentiable,
  const std::unordered_set<at::TensorImpl*> &dirty_inputs,
  const at::ArrayRef<c10::optional<Variable>> raw_outputs,
  const std::shared_ptr<Node> &cdata) {


  std::unordered_set<at::TensorImpl*> inputs;
  
  // Sets the grad_fn and output_nr of an output Variable.
  auto set_history = [&](Variable& var, uint32_t output_nr, bool is_input, bool is_modified,
                         bool is_differentiable) {
    // Lots of checks
    if (!is_differentiable) {
     ...
    } else if (is_input) {
      // An input has been returned, but it wasn't modified. Return it as a view
      // so that we can attach a new grad_fn to the Variable.
      // Run in no_grad mode to mimic the behavior of the forward.
      {
        AutoGradMode grad_mode(false);
        var = var.view_as(var);
      }
      impl::set_gradient_edge(var, {cdata, output_nr});
    } else if (cdata) {
      impl::set_gradient_edge(var, {cdata, output_nr});
    }
  };

And this is where set_gradient_edge was called and this is how a user-written python function gets included in the computational graph with its associated backward function!

Closing remarks

This blog post is intended to be a code overview on how PyTorch constructs the actual computational graphs that we discussed in the previous post. The next entry will deal with how the autograd engine executes these graphs.

Read More

Announcing PyTorch Developer Day 2021

We are excited to announce PyTorch Developer Day (#PTD2), taking place virtually from December 1 & 2, 2021. Developer Day is designed for developers and users to discuss core technical developments, ideas, and roadmaps.

Event Details

Technical Talks Live Stream – December 1, 2021

Join us for technical talks on a variety of topics, including updates to the core framework, new tools and libraries to support development across a variety of domains, responsible AI and industry use cases. All talks will take place on December 1 and will be live streamed on PyTorch channels.

Stay up to date by following us on our social channels: Twitter, Facebook, or LinkedIn.

Poster Exhibition & Networking – December 2, 2021

On the second day, we’ll be hosting an online poster exhibition on Gather.Town. There will be opportunities to meet the authors and learn more about their PyTorch projects as well as network with the community. This poster and networking event is limited to people composed of PyTorch maintainers and contributors, long-time stakeholders and experts in areas relevant to PyTorch’s future. Conversations from the networking event will strongly shape the future of PyTorch. As such, invitations are required to attend the networking event.

Apply for an invitation to the networking event by clicking here.

Call for Content Now Open

Submit your poster abstracts today! Please send us the title and brief summary of your project, tools and libraries that could benefit PyTorch researchers in academia and industry, application developers, and ML engineers for consideration. The focus must be on academic papers, machine learning research, or open-source projects related to PyTorch development, Responsible AI or Mobile. Please no sales pitches. Deadline for submission is September 24, 2021.

You can submit your poster abstract during your application & registration process here.

Visit the event website for more information and we look forward to having you at PyTorch Developer Day. For any questions about the event, contact pytorch@fbreg.com.

Read More

PipeTransformer: Automated Elastic Pipelining for Distributed Training of Large-scale Models

In this blog post, we describe the first peer-reviewed research paper that explores accelerating the hybrid of PyTorch DDP (torch.nn.parallel.DistributedDataParallel) [1] and Pipeline (torch.distributed.pipeline) – PipeTransformer: Automated Elastic Pipelining for Distributed Training of Large-scale Models (Transformers such as BERT [2] and ViT [3]), published at ICML 2021.

PipeTransformer leverages automated elastic pipelining for efficient distributed training of Transformer models. In PipeTransformer, we designed an adaptive on-the-fly freeze algorithm that can identify and freeze some layers gradually during training and an elastic pipelining system that can dynamically allocate resources to train the remaining active layers. More specifically, PipeTransformer automatically excludes frozen layers from the pipeline, packs active layers into fewer GPUs, and forks more replicas to increase data-parallel width. We evaluate PipeTransformer using Vision Transformer (ViT) on ImageNet and BERT on SQuAD and GLUE datasets. Our results show that compared to the state-of-the-art baseline, PipeTransformer attains up to 2.83-fold speedup without losing accuracy. We also provide various performance analyses for a more comprehensive understanding of our algorithmic and system-wise design.

Next, we will introduce the background, motivation, our idea, design, and how we implement the algorithm and system with PyTorch Distributed APIs.

Introduction

Model Size

Figure 1: the Parameter Number of Transformer Models Increases Dramatically.

Large Transformer models [4][5] have powered accuracy breakthroughs in both natural language processing and computer vision. GPT-3 [4] hit a new record high accuracy for nearly all NLP tasks. Vision Transformer (ViT) [3] also achieved 89% top-1 accuracy in ImageNet, outperforming state-of-the-art convolutional networks ResNet-152 and EfficientNet. To tackle the growth in model sizes, researchers have proposed various distributed training techniques, including parameter servers [6][7][8], pipeline parallelism [9][10][11][12], intra-layer parallelism [13][14][15], and zero redundancy data-parallel [16].

Existing distributed training solutions, however, only study scenarios where all model weights are required to be optimized throughout the training (i.e., computation and communication overhead remains relatively static over different iterations). Recent works on progressive training suggest that parameters in neural networks can be trained dynamically:

  • Freeze Training: Singular Vector Canonical Correlation Analysis for Deep Learning Dynamics and Interpretability. NeurIPS 2017
  • Efficient Training of BERT by Progressively Stacking. ICML 2019
  • Accelerating Training of Transformer-Based Language Models with Progressive Layer Dropping. NeurIPS 2020.
  • On the Transformer Growth for Progressive BERT Training. NACCL 2021

Freeze Training

Figure 2. Interpretable Freeze Training: DNNs converge bottom-up (Results on CIFAR10 using ResNet). Each pane shows layer-by-layer similarity using SVCCA [17][18]

For example, in freeze training [17][18], neural networks usually converge from the bottom-up (i.e., not all layers need to be trained all the way through training). Figure 2 shows an example of how weights gradually stabilize during training in this approach. This observation motivates us to utilize freeze training for distributed training of Transformer models to accelerate training by dynamically allocating resources to focus on a shrinking set of active layers. Such a layer freezing strategy is especially pertinent to pipeline parallelism, as excluding consecutive bottom layers from the pipeline can reduce computation, memory, and communication overhead.


Figure 3. The process of PipeTransformer’s automated and elastic pipelining to accelerate distributed training of Transformer models

We propose PipeTransformer, an elastic pipelining training acceleration framework that automatically reacts to frozen layers by dynamically transforming the scope of the pipelined model and the number of pipeline replicas. To the best of our knowledge, this is the first paper that studies layer freezing in the context of both pipeline and data-parallel training. Figure 3 demonstrates the benefits of such a combination. First, by excluding frozen layers from the pipeline, the same model can be packed into fewer GPUs, leading to both fewer cross-GPU communications and smaller pipeline bubbles. Second, after packing the model into fewer GPUs, the same cluster can accommodate more pipeline replicas, increasing the width of data parallelism. More importantly, the speedups acquired from these two benefits are multiplicative rather than additive, further accelerating the training.

The design of PipeTransformer faces four major challenges. First, the freeze algorithm must make on-the-fly and adaptive freezing decisions; however, existing work [17][18] only provides a posterior analysis tool. Second, the efficiency of pipeline re-partitioning results is influenced by multiple factors, including partition granularity, cross-partition activation size, and the chunking (the number of micro-batches) in mini-batches, which require reasoning and searching in a large solution space. Third, to dynamically introduce additional pipeline replicas, PipeTransformer must overcome the static nature of collective communications and avoid potentially complex cross-process messaging protocols when onboarding new processes (one pipeline is handled by one process). Finally, caching can save time for repeated forward propagation of frozen layers, but it must be shared between existing pipelines and newly added ones, as the system cannot afford to create and warm up a dedicated cache for each replica.

Freeze Training

Figure 4: An Animation to Show the Dynamics of PipeTransformer

As shown in the animation (Figure 4), PipeTransformer is designed with four core building blocks to address the aforementioned challenges. First, we design a tunable and adaptive algorithm to generate signals that guide the selection of layers to freeze over different iterations (Freeze Algorithm). Once triggered by these signals, our elastic pipelining module (AutoPipe), then packs the remaining active layers into fewer GPUs by taking both activation sizes and variances of workloads across heterogeneous partitions (frozen layers and active layers) into account. It then splits a mini-batch into an optimal number of micro-batches based on prior profiling results for different pipeline lengths. Our next module, AutoDP, spawns additional pipeline replicas to occupy freed-up GPUs and maintains hierarchical communication process groups to attain dynamic membership for collective communications. Our final module, AutoCache, efficiently shares activations across existing and new data-parallel processes and automatically replaces stale caches during transitions.

Overall, PipeTransformer combines the Freeze Algorithm, AutoPipe, AutoDP, and AutoCache modules to provide a significant training speedup.
We evaluate PipeTransformer using Vision Transformer (ViT) on ImageNet and BERT on GLUE and SQuAD datasets. Our results show that PipeTransformer attains up to 2.83-fold speedup without losing accuracy. We also provide various performance analyses for a more comprehensive understanding of our algorithmic and system-wise design.
Finally, we have also developed open-source flexible APIs for PipeTransformer, which offer a clean separation among the freeze algorithm, model definitions, and training accelerations, allowing for transferability to other algorithms that require similar freezing strategies.

Overall Design

Suppose we aim to train a massive model in a distributed training system where the hybrid of pipelined model parallelism and data parallelism is used to target scenarios where either the memory of a single GPU device cannot hold the model, or if loaded, the batch size is small enough to avoid running out of memory. More specifically, we define our settings as follows:

Training task and model definition. We train Transformer models (e.g., Vision Transformer, BERT on large-scale image or text datasets. The Transformer model has layers, in which the th layer is composed of a forward computation function and a corresponding set of parameters.

Training infrastructure. Assume the training infrastructure contains a GPU cluster that has GPU servers (i.e. nodes). Each node has GPUs. Our cluster is homogeneous, meaning that each GPU and server have the same hardware configuration. Each GPU’s memory capacity is . Servers are connected by a high bandwidth network interface such as InfiniBand interconnect.

Pipeline parallelism. In each machine, we load a model into a pipeline which has partitions ( also represents the pipeline length). The th partition consists of consecutive layers. We assume each partition is handled by a single GPU device. , meaning that we can build multiple pipelines for multiple model replicas in a single machine. We assume all GPU devices in a pipeline belonging to the same machine. Our pipeline is a synchronous pipeline, which does not involve stale gradients, and the number of micro-batches is . In the Linux OS, each pipeline is handled by a single process. We refer the reader to GPipe [10] for more details.

Data parallelism. DDP is a cross-machine distributed data-parallel process group within parallel workers. Each worker is a pipeline replica (a single process). The th worker’s index (ID) is rank . For any two pipelines in DDP, they can belong to either the same GPU server or different GPU servers, and they can exchange gradients with the AllReduce algorithm.

Under these settings, our goal is to accelerate training by leveraging freeze training, which does not require all layers to be trained throughout the duration of the training. Additionally, it may help save computation, communication, memory cost, and potentially prevent overfitting by consecutively freezing layers. However, these benefits can only be achieved by overcoming the four challenges of designing an adaptive freezing algorithm, dynamical pipeline re-partitioning, efficient resource reallocation, and cross-process caching, as discussed in the introduction.

Overview

Figure 5. Overview of PipeTransformer Training System

PipeTransformer co-designs an on-the-fly freeze algorithm and an automated elastic pipelining training system that can dynamically transform the scope of the pipelined model and the number of pipeline replicas. The overall system architecture is illustrated in Figure 5. To support PipeTransformer’s elastic pipelining, we maintain a customized version of PyTorch Pipeline. For data parallelism, we use PyTorch DDP as a baseline. Other libraries are standard mechanisms of an operating system (e.g.,multi-processing) and thus avoid specialized software or hardware customization requirements. To ensure the generality of our framework, we have decoupled the training system into four core components: freeze algorithm, AutoPipe, AutoDP, and AutoCache. The freeze algorithm (grey) samples indicators from the training loop and makes layer-wise freezing decisions, which will be shared with AutoPipe (green). AutoPipe is an elastic pipeline module that speeds up training by excluding frozen layers from the pipeline and packing the active layers into fewer GPUs (pink), leading to both fewer cross-GPU communications and smaller pipeline bubbles. Subsequently, AutoPipe passes pipeline length information to AutoDP (purple), which then spawns more pipeline replicas to increase data-parallel width, if possible. The illustration also includes an example in which AutoDP introduces a new replica (purple). AutoCache (orange edges) is a cross-pipeline caching module, as illustrated by connections between pipelines. The source code architecture is aligned with Figure 5 for readability and generality.

Implementation Using PyTorch APIs

As can be seen from Figure 5, PipeTransformers contain four components: Freeze Algorithm, AutoPipe, AutoDP, and AutoCache. Among them, AutoPipe and AutoDP relies on PyTorch DDP (torch.nn.parallel.DistributedDataParallel) [1] and Pipeline (torch.distributed.pipeline), respectively. In this blog, we only highlight the key implementation details of AutoPipe and AutoDP. For details of Freeze Algorithm and AutoCache, please refer to our paper.

AutoPipe: Elastic Pipelining

AutoPipe can accelerate training by excluding frozen layers from the pipeline and packing the active layers into fewer GPUs. This section elaborates on the key components of AutoPipe that dynamically 1) partition pipelines, 2) minimize the number of pipeline devices, and 3) optimize mini-batch chunk size accordingly.

Basic Usage of PyTorch Pipeline

Before diving into details of AutoPipe, let us warm up the basic usage of PyTorch Pipeline (torch.distributed.pipeline.sync.Pipe, see this tutorial). More specially, we present a simple example to understand the design of Pipeline in practice:

# Step 1: build a model including two linear layers
fc1 = nn.Linear(16, 8).cuda(0)
fc2 = nn.Linear(8, 4).cuda(1)

# Step 2: wrap the two layers with nn.Sequential
model = nn.Sequential(fc1, fc2)

# Step 3: build Pipe (torch.distributed.pipeline.sync.Pipe)
model = Pipe(model, chunks=8)

# do training/inference
input = torch.rand(16, 16).cuda(0)
output_rref = model(input)

In this basic example, we can see that before initializing Pipe, we need to partition the model nn.Sequential into multiple GPU devices and set optimal chunk number (chunks). Balancing computation time across partitions is critical to pipeline training speed, as skewed workload distributions across stages can lead to stragglers and forcing devices with lighter workloads to wait. The chunk number may also have a non-trivial influence on the throughput of the pipeline.

Balanced Pipeline Partitioning

In dynamic training system such as PipeTransformer, maintaining optimally balanced partitions in terms of parameter numbers does not guarantee the fastest training speed because other factors also play a crucial role:


Figure 6. The partition boundary is in the middle of a skip connection

  1. Cross-partition communication overhead. Placing a partition boundary in the middle of a skip connection leads to additional communications since tensors in the skip connection must now be copied to a different GPU. For example, with BERT partitions in Figure 6, partition must take intermediate outputs from both partition and partition . In contrast, if the boundary is placed after the addition layer, the communication overhead between partition and is visibly smaller. Our measurements show that having cross-device communication is more expensive than having slightly imbalanced partitions (see the Appendix in our paper). Therefore, we do not consider breaking skip connections (highlighted separately as an entire attention layer and MLP layer in green color at line 7 in Algorithm 1.

  2. Frozen layer memory footprint. During training, AutoPipe must recompute partition boundaries several times to balance two distinct types of layers: frozen layers and active layers. The frozen layer’s memory cost is a fraction of that inactive layer, given that the frozen layer does not need backward activation maps, optimizer states, and gradients. Instead of launching intrusive profilers to obtain thorough metrics on memory and computational cost, we define a tunable cost factor to estimate the memory footprint ratio of a frozen layer over the same active layer. Based on empirical measurements in our experimental hardware, we set it to .


Based on the above two considerations, AutoPipe balances pipeline partitions based on parameter sizes. More specifically, AutoPipe uses a greedy algorithm to allocate all frozen and active layers to evenly distribute partitioned sublayers into GPU devices. Pseudocode is described as the load_balance() function in Algorithm 1. The frozen layers are extracted from the original model and kept in a separate model instance in the first device of a pipeline.

Note that the partition algorithm employed in this paper is not the only option; PipeTransformer is modularized to work with any alternatives.

Pipeline Compression

Pipeline compression helps to free up GPUs to accommodate more pipeline replicas and reduce the number of cross-device communications between partitions. To determine the timing of compression, we can estimate the memory cost of the largest partition after compression, and then compare it with that of the largest partition of a pipeline at timestep . To avoid extensive memory profiling, the compression algorithm uses the parameter size as a proxy for the training memory footprint. Based on this simplification, the criterion of pipeline compression is as follows:


Once the freeze notification is received, AutoPipe will always attempt to divide the pipeline length by 2 (e.g., from 8 to 4, then 2). By using as the input, the compression algorithm can verify if the result satisfies the criterion in Equation (1). Pseudocode is shown in lines 25-33 in Algorithm 1. Note that this compression makes the acceleration ratio exponentially increase during training, meaning that if a GPU server has a larger number of GPUs (e.g., more than 8), the acceleration ratio will be further amplified.


Figure 7. Pipeline Bubble: , and denote forward, backward, and the optimizer update of micro-batch on device , respectively. The total bubble size in each iteration is times per micro-batch forward and backward cost.

Additionally, such a technique can also speed up training by shrinking the size of pipeline bubbles. To explain bubble sizes in a pipeline, Figure 7 depicts how 4 micro-batches run through a 4-device pipeline . In general, the total bubble size is times per micro-batch forward and backward cost. Therefore, it is clear that shorter pipelines have smaller bubble sizes.

Dynamic Number of Micro-Batches

Prior pipeline parallel systems use a fixed number of micro-batches per mini-batch ( ). GPipe suggests , where is the number of partitions (pipeline length). However, given that PipeTransformer dynamically configures , we find it to be sub-optimal to maintain a static during training. Moreover, when integrated with DDP, the value of also has an impact on the efficiency of DDP gradient synchronizations. Since DDP must wait for the last micro-batch to finish its backward computation on a parameter before launching its gradient synchronization, finer micro-batches lead to a smaller overlap between computation and communication. Hence, instead of using a static value, PipeTransformer searches for optimal on the fly in the hybrid of DDP environment by enumerating values ranging from to . For a specific training environment, the profiling needs only to be done once (see Algorithm 1 line 35).

For the complete source code, please refer to https://github.com/Distributed-AI/PipeTransformer/blob/master/pipe_transformer/pipe/auto_pipe.py.

AutoDP: Spawning More Pipeline Replicas

As AutoPipe compresses the same pipeline into fewer GPUs, AutoDP can automatically spawn new pipeline replicas to increase data-parallel width.

Despite the conceptual simplicity, subtle dependencies on communications and states require careful design. The challenges are threefold:

  1. DDP Communication: Collective communications in PyTorch DDP requires static membership, which prevents new pipelines from connecting with existing ones;

  2. State Synchronization: newly activated processes must be consistent with existing pipelines in the training progress (e.g., epoch number and learning rate), weights and optimizer states, the boundary of frozen layers, and pipeline GPU range;

  3. Dataset Redistribution: the dataset should be re-balanced to match a dynamic number of pipelines. This not only avoids stragglers but also ensures that gradients from all DDP processes are equally weighted.


Figure 8. AutoDP: handling dynamical data-parallel with messaging between double process groups (Process 0-7 belong to machine 0, while process 8-15 belong to machine 1)

To tackle these challenges, we create double communication process groups for DDP. As in the example shown in Figure 8, the message process group (purple) is responsible for light-weight control messages and covers all processes, while the active training process group (yellow) only contains active processes and serves as a vehicle for heavy-weight tensor communications during training. The message group remains static, whereas the training group is dismantled and reconstructed to match active processes.
In T0, only processes 0 and 8 are active. During the transition to T1, process 0 activates processes 1 and 9 (newly added pipeline replicas) and synchronizes necessary information mentioned above using the message group. The four active processes then form a new training group, allowing static collective communications adaptive to dynamic memberships.
To redistribute the dataset, we implement a variant of DistributedSampler that can seamlessly adjust data samples to match the number of active pipeline replicas.

The above design also naturally helps to reduce DDP communication overhead. More specifically, when transitioning from T0 to T1, processes 0 and 1 destroy the existing DDP instances, and active processes construct a new DDP training group using a cached pipelined model (AutoPipe stores frozen model and cached model separately).

We use the following APIs to implement the design above.

import torch.distributed as dist
from torch.nn.parallel import DistributedDataParallel as DDP

# initialize the process group (this must be called in the initialization of PyTorch DDP)
dist.init_process_group(init_method='tcp://' + str(self.config.master_addr) + ':' +
str(self.config.master_port), backend=Backend.GLOO, rank=self.global_rank, world_size=self.world_size)
...

# create active process group (yellow color)
self.active_process_group = dist.new_group(ranks=self.active_ranks, backend=Backend.NCCL, timeout=timedelta(days=365))
...

# create message process group (yellow color)
self.comm_broadcast_group = dist.new_group(ranks=[i for i in range(self.world_size)], backend=Backend.GLOO, timeout=timedelta(days=365))
...

# create DDP-enabled model when the number of data-parallel workers is changed. Note:
# 1. The process group to be used for distributed data all-reduction.
If None, the default process group, which is created by torch.distributed.init_process_group, will be used.
In our case, we set it as self.active_process_group
# 2. device_ids should be set when the pipeline length = 1 (the model resides on a single CUDA device).

self.pipe_len = gpu_num_per_process
if gpu_num_per_process > 1:
    model = DDP(model, process_group=self.active_process_group, find_unused_parameters=True)
else:
    model = DDP(model, device_ids=[self.local_rank], process_group=self.active_process_group, find_unused_parameters=True)

# to broadcast message among processes, we use dist.broadcast_object_list
def dist_broadcast(object_list, src, group):
    """Broadcasts a given object to all parties."""
    dist.broadcast_object_list(object_list, src, group=group)
    return object_list

For the complete source code, please refer to https://github.com/Distributed-AI/PipeTransformer/blob/master/pipe_transformer/dp/auto_dp.py.

Experiments

This section first summarizes experiment setups and then evaluates PipeTransformer using computer vision and natural language processing tasks.

Hardware. Experiments were conducted on 2 identical machines connected by InfiniBand CX353A (GB/s), where each machine is equipped with 8 NVIDIA Quadro RTX 5000 (16GB GPU memory). GPU-to-GPU bandwidth within a machine (PCI 3.0, 16 lanes) is GB/s.

Implementation. We used PyTorch Pipe as a building block. The BERT model definition, configuration, and related tokenizer are from HuggingFace 3.5.0. We implemented Vision Transformer using PyTorch by following its TensorFlow implementation. More details can be found in our source code.

Models and Datasets. Experiments employ two representative Transformers in CV and NLP: Vision Transformer (ViT) and BERT. ViT was run on an image classification task, initialized with pre-trained weights on ImageNet21K and fine-tuned on ImageNet and CIFAR-100. BERT was run on two tasks, text classification on the SST-2 dataset from the General Language Understanding Evaluation (GLUE) benchmark, and question answering on the SQuAD v1.1 Dataset (Stanford Question Answering), which is a collection of 100k crowdsourced question/answer pairs.

Training Schemes. Given that large models normally would require thousands of GPU-days {emph{e.g.}, GPT-3) if trained from scratch, fine-tuning downstream tasks using pre-trained models has become a trend in CV and NLP communities. Moreover, PipeTransformer is a complex training system that involves multiple core components. Thus, for the first version of PipeTransformer system development and algorithmic research, it is not cost-efficient to develop and evaluate from scratch using large-scale pre-training. Therefore, the experiments presented in this section focuses on pre-trained models. Note that since the model architectures in pre-training and fine-tuning are the same, PipeTransformer can serve both. We discussed pre-training results in the Appendix.

Baseline. Experiments in this section compare PipeTransformer to the state-of-the-art framework, a hybrid scheme of PyTorch Pipeline (PyTorch’s implementation of GPipe) and PyTorch DDP. Since this is the first paper that studies accelerating distributed training by freezing layers, there are no perfectly aligned counterpart solutions yet.

Hyper-parameters. Experiments use ViT-B/16 (12 transformer layers, input patch size) for ImageNet and CIFAR-100, BERT-large-uncased (24 layers) for SQuAD 1.1, and BERT-base-uncased (12 layers) for SST-2. With PipeTransformer, ViT and BERT training can set the per-pipeline batch size to around 400 and 64, respectively. Other hyperparameters (e.g., epoch, learning rate) for all experiments are presented in Appendix.

Overall Training Acceleration


We summarize the overall experimental results in the table above. Note that the speedup we report is based on a conservative value that can obtain comparable or even higher accuracy. A more aggressive (, ) can obtain a higher speedup but may lead to a slight loss in accuracy. Note that the model size of BERT (24 layers) is larger than ViT-B/16 (12 layers), thus it takes more time for communication.

Performance Analysis

Speedup Breakdown

This section presents evaluation results and analyzes the performance of different components in autopipe. More experimental results can be found in the Appendix.


Figure 9. Speedup Breakdown (ViT on ImageNet)

To understand the efficacy of all four components and their impacts on training speed, we experimented with different combinations and used their training sample throughput (samples/second) and speedup ratio as metrics. Results are illustrated in Figure 9. Key takeaways from these experimental results are:

  1. the main speedup is the result of elastic pipelining which is achieved through the joint use of AutoPipe and AutoDP;
  2. AutoCache’s contribution is amplified by AutoDP;
  3. freeze training alone without system-wise adjustment even downgrades the training speed.

Tuning in Freezing Algorithm


Figure 10. Tuning in Freezing Algorithm

We ran experiments to show how the in the freeze algorithms influences training speed. The result clearly demonstrates that a larger (excessive freeze) leads to a greater speedup but suffers from a slight performance degradation. In the case shown in Figure 10, where , freeze training outperforms normal training and obtains a -fold speedup. We provide more results in the Appendix.

Optimal Chunks in the elastic pipeline


Figure 11. Optimal chunk number in the elastic pipeline

We profiled the optimal number of micro-batches for different pipeline lengths . Results are summarized in Figure 11. As we can see, different values lead to different optimal , and the throughput gaps across different M values are large (as shown when ), which confirms the necessity of an anterior profiler in elastic pipelining.

Understanding the Timing of Caching


Figure 12. the timing of caching

To evaluate AutoCache, we compared the sample throughput of training that activates AutoCache from epoch (blue) with the training job without AutoCache (red). Figure 12 shows that enabling caching too early can slow down training, as caching can be more expensive than the forward propagation on a small number of frozen layers. After more layers are frozen, caching activations clearly outperform the corresponding forward propagation. As a result, AutoCache uses a profiler to determine the proper timing to enable caching. In our system, for ViT (12 layers), caching starts from 3 frozen layers, while for BERT (24 layers), caching starts from 5 frozen layers.

For more detailed experimental analysis, please refer to our paper.

Summarization

This blog introduces PipeTransformer, a holistic solution that combines elastic pipeline-parallel and data-parallel for distributed training using PyTorch Distributed APIs. More specifically, PipeTransformer incrementally freezes layers in the pipeline, packs remaining active layers into fewer GPUs, and forks more pipeline replicas to increase the data-parallel width. Evaluations on ViT and BERT models show that compared to the state-of-the-art baseline, PipeTransformer attains up to 2.83× speedups without accuracy loss.

Reference

[1] Li, S., Zhao, Y., Varma, R., Salpekar, O., Noordhuis, P., Li,T., Paszke, A., Smith, J., Vaughan, B., Damania, P., et al. Pytorch Distributed: Experiences on Accelerating Dataparallel Training. Proceedings of the VLDB Endowment,13(12), 2020

[2] Devlin, J., Chang, M. W., Lee, K., and Toutanova, K. BERT: Pre-training of Deep Bidirectional Transformers for Language Understanding. In NAACL-HLT, 2019

[3] Dosovitskiy, A., Beyer, L., Kolesnikov, A., Weissenborn, D., Zhai, X., Unterthiner, T., Dehghani, M., Minderer, M., Heigold, G., Gelly, S., et al. An image is Worth 16×16 words: Transformers for Image Recognition at Scale.

[4] Brown, T. B., Mann, B., Ryder, N., Subbiah, M., Kaplan, J., Dhariwal, P., Neelakantan, A., Shyam, P., Sastry, G., Askell, A., et al. Language Models are Few-shot Learners.

[5] Lepikhin, D., Lee, H., Xu, Y., Chen, D., Firat, O., Huang, Y., Krikun, M., Shazeer, N., and Chen, Z. Gshard: Scaling Giant Models with Conditional Computation and Automatic Sharding.

[6] Li, M., Andersen, D. G., Park, J. W., Smola, A. J., Ahmed, A., Josifovski, V., Long, J., Shekita, E. J., and Su, B. Y. Scaling Distributed Machine Learning with the Parameter Server. In 11th {USENIX} Symposium on Operating Systems Design and Implementation ({OSDI} 14), pp. 583–598, 2014.

[7] Jiang, Y., Zhu, Y., Lan, C., Yi, B., Cui, Y., and Guo, C. A Unified Architecture for Accelerating Distributed DNN Training in Heterogeneous GPU/CPU Clusters. In 14th USENIX Symposium on Operating Systems Design and Implementation (OSDI 20), pp. 463–479. USENIX Association, November 2020. ISBN 978-1-939133-19- 9.

[8] Kim, S., Yu, G. I., Park, H., Cho, S., Jeong, E., Ha, H., Lee, S., Jeong, J. S., and Chun, B. G. Parallax: Sparsity-aware Data Parallel Training of Deep Neural Networks. In Proceedings of the Fourteenth EuroSys Conference 2019, pp. 1–15, 2019.

[9] Kim, C., Lee, H., Jeong, M., Baek, W., Yoon, B., Kim, I., Lim, S., and Kim, S. TorchGPipe: On-the-fly Pipeline Parallelism for Training Giant Models.

[10] Huang, Y., Cheng, Y., Bapna, A., Firat, O., Chen, M. X., Chen, D., Lee, H., Ngiam, J., Le, Q. V., Wu, Y., et al. Gpipe: Efficient Training of Giant Neural Networks using Pipeline Parallelism.

[11] Park, J. H., Yun, G., Yi, C. M., Nguyen, N. T., Lee, S., Choi, J., Noh, S. H., and ri Choi, Y. Hetpipe: Enabling Large DNN Training on (whimpy) Heterogeneous GPU Clusters through Integration of Pipelined Model Parallelism and Data Parallelism. In 2020 USENIX Annual Technical Conference (USENIX ATC 20), pp. 307–321. USENIX Association, July 2020. ISBN 978-1-939133- 14-4.

[12] Narayanan, D., Harlap, A., Phanishayee, A., Seshadri, V., Devanur, N. R., Ganger, G. R., Gibbons, P. B., and Zaharia, M. Pipedream: Generalized Pipeline Parallelism for DNN Training. In Proceedings of the 27th ACM Symposium on Operating Systems Principles, SOSP ’19, pp. 1–15, New York, NY, USA, 2019. Association for Computing Machinery. ISBN 9781450368735. doi: 10.1145/3341301.3359646.

[13] Lepikhin, D., Lee, H., Xu, Y., Chen, D., Firat, O., Huang, Y., Krikun, M., Shazeer, N., and Chen, Z. Gshard: Scaling Giant Models with Conditional Computation and Automatic Sharding.

[14] Shazeer, N., Cheng, Y., Parmar, N., Tran, D., Vaswani, A., Koanantakool, P., Hawkins, P., Lee, H., Hong, M., Young, C., Sepassi, R., and Hechtman, B. Mesh-Tensorflow: Deep Learning for Supercomputers. In Bengio, S., Wallach, H., Larochelle, H., Grauman, K., Cesa-Bianchi, N., and Garnett, R. (eds.), Advances in Neural Information Processing Systems, volume 31, pp. 10414–10423. Curran Associates, Inc., 2018.

[15] Shoeybi, M., Patwary, M., Puri, R., LeGresley, P., Casper, J., and Catanzaro, B. Megatron-LM: Training Multi-billion Parameter Language Models using Model Parallelism.

[16] Rajbhandari, S., Rasley, J., Ruwase, O., and He, Y. ZERO: Memory Optimization towards Training a Trillion Parameter Models.

[17] Raghu, M., Gilmer, J., Yosinski, J., and Sohl Dickstein, J. Svcca: Singular Vector Canonical Correlation Analysis for Deep Learning Dynamics and Interpretability. In NIPS, 2017.

[18] Morcos, A., Raghu, M., and Bengio, S. Insights on Representational Similarity in Neural Networks with Canonical Correlation. In Bengio, S., Wallach, H., Larochelle, H., Grauman, K., Cesa-Bianchi, N., and Garnett, R. (eds.), Advances in Neural Information Processing Systems 31, pp. 5732–5741. Curran Associates, Inc., 2018.

Read More

What’s New in PyTorch Profiler 1.9?

PyTorch Profiler v1.9 has been released! The goal of this new release (previous PyTorch Profiler release) is to provide you with new state-of-the-art tools to help diagnose and fix machine learning performance issues regardless of whether you are working on one or numerous machines. The objective is to target the execution steps that are the most costly in time and/or memory, and visualize the work load distribution between GPUs and CPUs.

Here is a summary of the five major features being released:

  1. Distributed Training View: This helps you understand how much time and memory is consumed in your distributed training job. Many issues occur when you take a training model and split the load into worker nodes to be run in parallel as it can be a black box. The overall model goal is to speed up model training. This distributed training view will help you diagnose and debug issues within individual nodes.
  2. Memory View: This view allows you to understand your memory usage better. This tool will help you avoid the famously pesky Out of Memory error by showing active memory allocations at various points of your program run.
  3. GPU Utilization Visualization: This tool helps you make sure that your GPU is being fully utilized.
  4. Cloud Storage Support: Tensorboard plugin can now read profiling data from Azure Blob Storage, Amazon S3, and Google Cloud Platform.
  5. Jump to Source Code: This feature allows you to visualize stack tracing information and jump directly into the source code. This helps you quickly optimize and iterate on your code based on your profiling results.

Getting Started with PyTorch Profiling Tool

PyTorch includes a profiling functionality called « PyTorch Profiler ». The PyTorch Profiler tutorial can be found here.

To instrument your PyTorch code for profiling, you must:

$ pip install torch-tb-profiler

import torch.profiler as profiler
With profiler.profile(XXXX)

Comments:

• For CUDA and CPU profiling, see below:

with torch.profiler.profile( 
activities=[ 
torch.profiler.ProfilerActivity.CPU, 
torch.profiler.ProfilerActivity.CUDA], 

• With profiler.record_function(“$NAME”): allows putting a decorator (a tag associated to a name) for a block of function

• Profile_memory=True parameter under profiler.profile allows you to profile CPU and GPU memory footprint

Visualizing PyTorch Model Performance using PyTorch Profiler

Distributed Training

Recent advances in deep learning argue for the value of large datasets and large models, which requires you to scale out model training to more computational resources. Distributed Data Parallel (DDP) and NVIDIA Collective Communications Library (NCCL) are the widely adopted paradigms in PyTorch for accelerating your deep learning training.

In this release of PyTorch Profiler, DDP with NCCL backend is now supported.

Computation/Communication Overview

In the Computation/Communication overview under the Distributed training view, you can observe the computation-to-communication ratio of each worker and [load balancer](https://en.wikipedia.org/wiki/Load_balancing_(computing) nodes between worker as measured by granularity.

Scenario 1:

If the computation and overlapping time of one worker is much larger than the others, this may suggest an issue in the workload balance or worker being a straggler. Computation is the sum of kernel time on GPU minus the overlapping time. The overlapping time is the time saved by interleaving communications during computation. The more overlapping time represents better parallelism between computation and communication. Ideally the computation and communication completely overlap with each other. Communication is the total communication time minus the overlapping time. The example image below displays how this scenario appears on Tensorboard.

Figure: A straggler example

Scenario 2:

If there is a small batch size (i.e. less computation on each worker) or the data to be transferred is large, the computation-to-communication may also be small and be seen in the profiler with low GPU utilization and long waiting times. This computation/communication view will allow you to diagnose your code to reduce communication by adopting gradient accumulation, or to decrease the communication proportion by increasing batch size. DDP communication time depends on model size. Batch size has no relationship with model size. So increasing batch size could make computation time longer and make computation-to-communication ratio bigger.

Synchronizing/Communication Overview

In the Synchronizing/Communication view, you can observe the efficiency of communication. This is done by taking the step time minus computation and communication time. Synchronizing time is part of the total communication time for waiting and synchronizing with other workers. The Synchronizing/Communication view includes initialization, data loader, CPU computation, and so on Insights like what is the ratio of total communication is really used for exchanging data and what is the idle time of waiting for data from other workers can be drawn from this view.

For example, if there is an inefficient workload balance or straggler issue, you’ll be able to identify it in this Synchronizing/Communication view. This view will show several workers’ waiting time being longer than others.

This table view above allows you to see the detailed statistics of all communication ops in each node. This allows you to see what operation types are being called, how many times each op is called, what is the size of the data being transferred by each op, etc.

Memory View:

This memory view tool helps you understand the hardware resource consumption of the operators in your model. Understanding the time and memory consumption on the operator-level allows you to resolve performance bottlenecks and in turn, allow your model to execute faster. Given limited GPU memory size, optimizing the memory usage can:

  1. Allow bigger model which can potentially generalize better on end level tasks.
  2. Allow bigger batch size. Bigger batch sizes increase the training speed.

The profiler records all the memory allocation during the profiler interval. Selecting the “Device” will allow you to see each operator’s memory usage on the GPU side or host side. You must enable profile_memory=True to generate the below memory data as shown here.

With torch.profiler.profile(
Profiler_memory=True # this will take 1 – 2 minutes to complete. 
)

Important Definitions:

• “Size Increase” displays the sum of all allocation bytes and minus all the memory release bytes.

• “Allocation Size” shows the sum of all allocation bytes without considering the memory release.

• “Self” means the allocated memory is not from any child operators, instead by the operator itself.

GPU Metric on Timeline:

This feature will help you debug performance issues when one or more GPU are underutilized. Ideally, your program should have high GPU utilization (aiming for 100% GPU utilization), minimal CPU to GPU communication, and no overhead.

Overview:
The overview page highlights the results of three important GPU usage metrics at different levels (i.e. GPU Utilization, Est. SM Efficiency, and Est. Achieved Occupancy). Essentially, each GPU has a bunch of SM each with a bunch of warps that can execute a bunch of threads concurrently. Warps execute a bunch because the amount depends on the GPU. But at a high level, this GPU Metric on Timeline tool allows you can see the whole stack, which is useful.

If the GPU utilization result is low, this suggests a potential bottleneck is present in your model. Common reasons:

•Insufficient parallelism in kernels (i.e., low batch size)

•Small kernels called in a loop. This is to say the launch overheads are not amortized

•CPU or I/O bottlenecks lead to the GPU not receiving enough work to keep busy

Looking of the overview page where the performance recommendation section is where you’ll find potential suggestions on how to increase that GPU utilization. In this example, GPU utilization is low so the performance recommendation was to increase batch size. Increasing batch size 4 to 32, as per the performance recommendation, increased the GPU Utilization by 60.68%.

GPU Utilization: the step interval time in the profiler when a GPU engine was executing a workload. The high the utilization %, the better. The drawback of using GPU utilization solely to diagnose performance bottlenecks is it is too high-level and coarse. It won’t be able to tell you how many Streaming Multiprocessors are in use. Note that while this metric is useful for detecting periods of idleness, a high value does not indicate efficient use of the GPU, only that it is doing anything at all. For instance, a kernel with a single thread running continuously will get a GPU Utilization of 100%

Estimated Stream Multiprocessor Efficiency (Est. SM Efficiency) is a finer grained metric, it indicates what percentage of SMs are in use at any point in the trace This metric reports the percentage of time where there is at least one active warp on a SM and those that are stalled (NVIDIA doc). Est. SM Efficiency also has it’s limitation. For instance, a kernel with only one thread per block can’t fully use each SM. SM Efficiency does not tell us how busy each SM is, only that they are doing anything at all, which can include stalling while waiting on the result of a memory load. To keep an SM busy, it is necessary to have a sufficient number of ready warps that can be run whenever a stall occurs

Estimated Achieved Occupancy (Est. Achieved Occupancy) is a layer deeper than Est. SM Efficiency and GPU Utilization for diagnosing performance issues. Estimated Achieved Occupancy indicates how many warps can be active at once per SMs. Having a sufficient number of active warps is usually key to achieving good throughput. Unlike GPU Utilization and SM Efficiency, it is not a goal to make this value as high as possible. As a rule of thumb, good throughput gains can be had by improving this metric to 15% and above. But at some point you will hit diminishing returns. If the value is already at 30% for example, further gains will be uncertain. This metric reports the average values of all warp schedulers for the kernel execution period (NVIDIA doc). The larger the Est. Achieve Occupancy value is the better.

Overview details: Resnet50_batchsize4

Overview details: Resnet50_batchsize32

Kernel View
The kernel has “Blocks per SM” and “Est. Achieved Occupancy” which is a great tool to compare model runs.

Mean Blocks per SM:
Blocks per SM = Blocks of this kernel / SM number of this GPU. If this number is less than 1, it indicates the GPU multiprocessors are not fully utilized. “Mean Blocks per SM” is weighted average of all runs of this kernel name, using each run’s duration as weight.

Mean Est. Achieved Occupancy:
Est. Achieved Occupancy is defined as above in overview. “Mean Est. Achieved Occupancy” is weighted average of all runs of this kernel name, using each run’s duration as weight.

Trace View
This trace view displays a timeline that shows the duration of operators in your model and which system executed the operation. This view can help you identify whether the high consumption and long execution is because of input or model training. Currently, this trace view shows GPU Utilization and Est. SM Efficiency on a timeline.

GPU utilization is calculated independently and divided into multiple 10 millisecond buckets. The buckets’ GPU utilization values are drawn alongside the timeline between 0 – 100%. In the above example, the “ProfilerStep5” GPU utilization during thread 28022’s busy time is higher than the following the one during “Optimizer.step”. This is where you can zoom-in to investigate why that is.

From above, we can see the former’s kernels are longer than the later’s kernels. The later’s kernels are too short in execution, which results in lower GPU utilization.

Est. SM Efficiency: Each kernel has a calculated est. SM efficiency between 0 – 100%. For example, the below kernel has only 64 blocks, while the SMs in this GPU is 80. Then its “Est. SM Efficiency” is 64/80, which is 0.8.

Cloud Storage Support

After running pip install tensorboard, to have data be read through these cloud providers, you can now run:

torch-tb-profiler[blob] 
torch-tb-profiler[gs] 
torch-tb-profiler[s3] 

pip install torch-tb-profiler[blob], pip install torch-tb-profiler[gs], or pip install torch-tb-profiler[S3] to have data be read through these cloud providers. For more information, please refer to this README.

Jump to Source Code:

One of the great benefits of having both TensorBoard and the PyTorch Profiler being integrated directly in Visual Studio Code (VS Code) is the ability to directly jump to the source code (file and line) from the profiler stack traces. VS Code Python Extension now supports TensorBoard Integration.

Jump to source is ONLY available when Tensorboard is launched within VS Code. Stack tracing will appear on the plugin UI if the profiling with_stack=True. When you click on a stack trace from the PyTorch Profiler, VS Code will automatically open the corresponding file side by side and jump directly to the line of code of interest for you to debug. This allows you to quickly make actionable optimizations and changes to your code based on the profiling results and suggestions.

Gify: Jump to Source using Visual Studio Code Plug In UI

For how to optimize batch size performance, check out the step-by-step tutorial here. PyTorch Profiler is also integrated with PyTorch Lightning and you can simply launch your lightning training jobs with –trainer.profiler=pytorch flag to generate the traces. Check out an example here.

What’s Next for the PyTorch Profiler?

You just saw how PyTorch Profiler can help optimize a model. You can now try the Profiler by pip install torch-tb-profiler to optimize your PyTorch model.

Look out for an advanced version of this tutorial in the future. If you want tailored enterprise-grade support for this, check out PyTorch Enterprise on Azure. We are also thrilled to continue to bring state-of-the-art tool to PyTorch users to improve ML performance. We’d love to hear from you. Feel free to open an issue here.

For new and exciting features coming up with PyTorch Profiler, follow @PyTorch on Twitter and check us out on pytorch.org.

Read More

Everything You Need To Know About Torchvision’s SSDlite Implementation

In the previous article, we’ve discussed how the SSD algorithm works, covered its implementation details and presented its training process. If you have not read the previous blog post, I encourage you to check it out before continuing.

In this part 2 of the series, we will focus on the mobile-friendly variant of SSD called SSDlite. Our plan is to first go through the main components of the algorithm highlighting the parts that differ from the original SSD, then discuss how the released model was trained and finally provide detailed benchmarks for all the new Object Detection models that we explored.

The SSDlite Network Architecture

The SSDlite is an adaptation of SSD which was first briefly introduced on the MobileNetV2 paper and later reused on the MobileNetV3 paper. Because the main focus of the two papers was to introduce novel CNN architectures, most of the implementation details of SSDlite were not clarified. Our code follows all the details presented on the two papers and where necessary fills the gaps from the official implementation.

As noted before, the SSD is a family of models because one can configure it with different backbones (such as VGG, MobileNetV3 etc) and different Heads (such as using regular convolutions, separable convolutions etc). Thus many of the SSD components remain the same in SSDlite. Below we discuss only those that are different

Classification and Regression Heads

Following the Section 6.2 of the MobileNetV2 paper, SSDlite replaces the regular convolutions used on the original Heads with separable convolutions. Consequently, our implementation introduces new heads that use 3×3 Depthwise convolutions and 1×1 projections. Since all other components of the SSD method remain the same, to create an SSDlite model our implementation initializes the SSDlite head and passes it directly to the SSD constructor.

Backbone Feature Extractor

Our implementation introduces a new class for building MobileNet feature extractors. Following the Section 6.3 of the MobileNetV3 paper, the backbone returns the output of the expansion layer of the Inverted Bottleneck block which has an output stride of 16 and the output of the layer just before the pooling which has an output stride of 32. Moreover, all extra blocks of the backbone are replaced with lightweight equivalents which use a 1×1 compression, a separable 3×3 convolution with stride 2 and a 1×1 expansion. Finally to ensure that the heads have enough prediction power even when small width multipliers are used, the minimum depth size of all convolutions is controlled by the min_depth hyperparameter.

The SSDlite320 MobileNetV3-Large model

This section discusses the configuration of the provided SSDlite pre-trained model along with the training processes followed to replicate the paper results as closely as possible.

Training process

All of the hyperparameters and scripts used to train the model on the COCO dataset can be found in our references folder. Here we discuss the most notable details of the training process.

Tuned Hyperparameters

Though the papers don’t provide any information on the hyperparameters used for training the models (such as regularization, learning rate and the batch size), the parameters listed in the configuration files on the official repo were good starting points and using cross validation we adjusted them to their optimal values. All the above gave us a significant boost over the baseline SSD configuration.

Data Augmentation

Key important difference of SSDlite comparing to SSD is that the backbone of the first has only a fraction of the weights of the latter. This is why in SSDlite, the Data Augmentation focuses more on making the model robust to objects of variable sizes than trying to avoid overfitting. Consequently, SSDlite uses only a subset of the SSD transformations and this way it avoids the over-regularization of the model.

LR Scheme

Due to the reliance on Data Augmentation to make the model robust to small and medium sized objects, we found that it is particularly beneficial for the training recipe to use large number of epochs. More specifically by using roughly 3x more epochs than SSD we are able to increase our precision by 4.2mAP points and by using a 6x multiplier we improve by 4.9mAP. Increasing further the epochs seems to yield diminishing returns and makes the training too slow and impractical, nevertheless based on the model configuration it seems that the authors of the paper used an equivalent 16x multiplier.

Weight Initialization & Input Scaling & ReLU6

A set of final optimizations that brought our implementation very close to the official one and helped us bridge the accuracy gap was training the backbone from scratch instead of initializing from ImageNet, adapting our weight initialization scheme, changing our Input Scaling and replacing all standard ReLUs added on the SSDlite heads with ReLU6. Note that since we trained the model from random weights, we additionally applied the speed optimization described on the paper of using a reduced tail on the backbone.

Implementation Differences

Comparing the above implementation with the one on the official repo, we’ve identified a few differences. Most of them are minor and they are related to how we initialize the weights (for example Normal initialization vs Truncated Normal), how we parameterize the LR Scheduling (for example smaller vs larger warmup rate, shorter vs longer training) etc. The biggest known difference lies in the way we compute the Classification loss. More specifically the implementation of SSDlite with MobileNetV3 backbone on the official repo doesn’t use the SSD’s Multibox loss but instead uses RetinaNet’s focal loss. This is a rather significant deviation from the paper and since TorchVision already offers a full implementation of RetinaNet, we decided to implement SSDlite using the normal Multi-box SSD loss.

Break down of key accuracy improvements

As discussed in previous articles, reproducing research papers and porting them to code is not a journey of monotonically increasing accuracies, especially in cases where the full training and implementation details are not known. Typically the process involves lots of backtracking as one needs to identify those implementation details and parameters that have significant impact on the accuracy from those that don’t. Below we try to visualize the most important iterations that improved our accuracy from the baseline:

Iteration mAP
Baseline with “SSD-style” Hyperparams 10.6
+ Tuned Hyperparams 14.2
+ SSDlite Data Augmentation 15.2
+ 3x LR Scheme 19.4
+ 6x LR Scheme 20.1
+ Weight Initialization & Input Scaling & ReLU6 21.3

The order of optimizations presented above is accurate, though a bit idealized in some cases. For example, though different schedulers were tested during the Hyperparameter tuning phase, none of them provided significant improvements and thus we maintained the MultiStepLR which was used in the baseline. Nevertheless while later experimenting with different LR Schemes, we found it beneficial to switch to CosineAnnealingLR, as it required less configuration. Consequently, we believe that the main takeaway from the above summary should be that even by starting with a correct implementation and a set of optimal hyperparams from a model of the same family, there is always accuracy points to be found by optimizing the training recipe and tuning the implementation. Admittedly the above is a rather extreme case where the accuracy doubled, but still in many cases there is a large number of optimizations that can help us push the accuracy significantly.

Benchmarks

Here is how to initialize the two pre-trained models:

ssdlite = torchvision.models.detection.ssdlite320_mobilenet_v3_large(pretrained=True)
ssd = torchvision.models.detection.ssd300_vgg16(pretrained=True)

Below are the benchmarks between the new and selected previous detection models:

Model mAP Inference on CPU (sec) # Params (M)
SSDlite320 MobileNetV3-Large 21.3 0.0911 3.44
SSD300 VGG16 25.1 0.8303 35.64
SSD512 VGG16 (not released) 28.8 2.2494 37.08
SSD512 ResNet50 (not released) 30.2 1.1137 42.70
Faster R-CNN MobileNetV3-Large 320 FPN (Low-Res) 22.8 0.1679 19.39
Faster R-CNN MobileNetV3-Large FPN (High-Res) 32.8 0.8409 19.39

As we can see, the SSDlite320 MobileNetV3-Large model is by far the fastest and smallest model and thus it’s an excellent candidate for real-world mobile applications. Though its accuracy is lower than the pre-trained low-resolution Faster R-CNN equivalent, the SSDlite framework is adaptable and one can boost its accuracy by introducing heavier heads with more convolutions.

On the other hand, the SSD300 VGG16 model is rather slow and less accurate. This is mainly because of its VGG16 backbone. Though extremely important and influential, the VGG architecture is nowadays quite outdated. Thus though the specific model has historical and research value and hence it’s included in TorchVision, we recommend to users who want high-resolution detectors for real world applications to either combine SSD with alternative backbones (see this example on how to create one) or use one of the Faster R-CNN pre-trained models.

We hope you enjoyed the 2nd and final part of the SSD series. We are looking forward to your feedback.

Read More

The torch.linalg module: Accelerated Linear Algebra with Autograd in PyTorch

Linear algebra is essential to deep learning and scientific computing, and it’s always been a core part of PyTorch. PyTorch 1.9 extends PyTorch’s support for linear algebra operations with the torch.linalg module. This module, documented here, has 26 operators, including faster and easier to use versions of older PyTorch operators, every function from NumPy’s linear algebra module extended with accelerator and autograd support, and a few operators that are completely new. This makes the torch.linalg immediately familiar to NumPy users and an exciting update to PyTorch’s linear algebra support.

NumPy-like linear algebra in PyTorch

If you’re familiar with NumPy’s linear algebra module then it’ll be easy to start using torch.linalg. In most cases it’s a drop-in replacement. Let’s looking at drawing samples from a multivariate normal distribution using the Cholesky decomposition as a motivating example to demonstrate this:

import numpy as np

# Creates inputs
np.random.seed(0)
mu_np = np.random.rand(4)
L = np.random.rand(4, 4)
# Covariance matrix sigma is positive-definite
sigma_np = L @ L.T + np.eye(4)
normal_noise_np = np.random.standard_normal(mu_np.size)

def multivariate_normal_sample_np(mu, sigma, normal_noise):
    return mu + np.linalg.cholesky(sigma) @ normal_noise

print("Random sample: ", 
      multivariate_normal_sample_np(mu_np, sigma_np, normal_noise_np))
: Random sample: [2.9502426 1.78518077 1.83168697 0.90798228]

Now let’s see the same sampler implemented in PyTorch:

import torch

def multivariate_normal_sample_torch(mu, sigma, normal_noise):
    return mu + torch.linalg.cholesky(sigma) @ normal_noise

The two functions are identical, and we can validate their behavior by calling the function with the same arguments wrapped as PyTorch tensors:

# NumPy arrays are wrapped as tensors and share their memory
mu_torch = torch.from_numpy(mu_np)
sigma_torch = torch.from_numpy(sigma_np)
normal_noise_torch = torch.from_numpy(normal_noise_np)

multivariate_normal_sample_torch(mu_torch, sigma_torch, normal_noise_torch)
: tensor([2.9502, 1.7852, 1.8317, 0.9080], dtype=torch.float64)

The only difference is in how PyTorch prints tensors by default.

The Cholesky decomposition can also help us quickly compute the probability density function of the non-degenerate multivariate normal distribution. One of the expensive terms in that computation is the square root of the determinant of the covariance matrix. Using properties of the determinant and the Cholesky decomposition we can calculate the same result faster than the naive computation, however. Here’s the NumPy program that demonstrates this:

sqrt_sigma_det_np = np.sqrt(np.linalg.det(sigma_np))
sqrt_L_det_np = np.prod(np.diag(np.linalg.cholesky(sigma_np)))

print("|sigma|^0.5 = ", sqrt_sigma_det_np)
: |sigma|^0.5 = 4.237127491242027
 
print("|L| = ", sqrt_L_det_np)
: |L| = 4.237127491242028

And here’s the same validation in PyTorch:

sqrt_sigma_det_torch = torch.sqrt(torch.linalg.det(sigma_torch))
sqrt_L_det_torch = torch.prod(torch.diag(torch.linalg.cholesky(sigma_torch)))

print("|sigma|^0.5 = ", sqrt_sigma_det_torch)
: |sigma|^0.5 = tensor(4.2371, dtype=torch.float64) 

print("|L| = ", sqrt_L_det_torch)
: |L| = tensor(4.2371, dtype=torch.float64)

We can measure the difference in run time using PyTorch’s built-in benchmark utility:

import torch.utils.benchmark as benchmark

t0 = benchmark.Timer(
    stmt='torch.sqrt(torch.linalg.det(sigma))',
    globals={'sigma': sigma_torch})

t1 = benchmark.Timer(
    stmt='torch.prod(torch.diag(torch.linalg.cholesky(sigma)))',
    globals={'sigma': sigma_torch})

print(t0.timeit(100))
: torch.sqrt(torch.linalg.det(sigma))
  80.80 us
  1 measurement, 100 runs , 1 thread


print(t1.timeit(100))
: torch.prod(torch.diag(torch.linalg.cholesky(sigma)))
  11.56 us
  1 measurement, 100 runs , 1 thread

Demonstrating that the approach using the Cholesky decomposition can be significantly faster. Behind the scenes, PyTorch’s linear algebra module uses OpenBLAS or MKL implementations of the LAPACK standard to maximize its CPU performance.

Autograd Support

PyTorch’s linear algebra module doesn’t just implement the same functions as NumPy’s linear algebra module (and a few more), it also extends them with autograd and CUDA support.

Let’s look at a very simple program that just computes an inverse and the gradient of that operation to show how autograd works:

t = torch.tensor(((1, 2), (3, 4)), dtype=torch.float32, requires_grad=True)

inv = torch.linalg.inv(t)
inv.backward(torch.ones_like(inv))

print(t.grad)
: tensor([[-0.5000, 0.5000],
          [ 0.5000, -0.5000]])

We can mimic the same computation in NumPy by defining the autograd formula ourselves:

a = np.array(((1, 2), (3, 4)), dtype=np.float32)

inv_np = np.linalg.inv(a)

def inv_backward(result, grad):
    return -(result.transpose(-2, -1) @ (grad @ result.transpose(-2, -1)))
grad_np = inv_backward(inv_np, np.ones_like(inv_np))

print(grad_np)
: [[-0.5 0.5]
   [ 0.5 -0.5]]

Of course, as programs become more complicated it’s convenient to have builtin autograd support, and PyTorch’s linear algebra module supports both real and complex autograd.

CUDA Support

Support for autograd and accelerators, like CUDA devices, is a core part of PyTorch. The torch.linalg module was developed with NVIDIA’s PyTorch and cuSOLVER teams, who helped optimize its performance on CUDA devices with the cuSOLVER, cuBLAS, and MAGMA libraries. These improvements make PyTorch’s CUDA linear algebra operations faster than ever. For example, let’s look at the performance of PyTorch 1.9’s torch.linalg.cholesky vs. PyTorch 1.8’s (now deprecated) torch.cholesky:

(The above charts were created using an Ampere A100 GPU with CUDA 11.3, cuSOLVER 11.1.1.58, and MAGMA 2.5.2. Matrices are in double precision.)

These charts show that performance has increased significantly on larger matrices, and that batched performance is better across the board. Other linear algebra operations, including torch.linalg.qr and torch.linalg.lstsq, have also had their CUDA performance improved.

Beyond NumPy

In addition to offering all the functions in NumPy’s linear algebra module with support for autograd and accelerators, torch.linalg has a few new functions of its own. NumPy’s linalg.norm does not allow users to compute vector norms over arbitrary subsets of dimensions, so to enable this functionality we added torch.linalg.vector_norm. We’ve also started modernizing other linear algebra functionality in PyTorch, so we created torch.linalg.householder_product to replace the older torch.orgqr, and we plan to continue adding more linear algebra functionality in the future, too.

The Future of Linear Algebra in PyTorch

The torch.linalg module is fast and familiar with great support for autograd and accelerators. It’s already being used in libraries like botorch, too. But we’re not stopping here. We plan to continue updating more of PyTorch’s existing linear algebra functionality (like torch.lobpcg) and offering more support for low rank and sparse linear algebra. We also want to hear your feedback on how we can improve, so start a conversation on the forum or file an issue on our Github and share your thoughts.

We look forward to hearing from you and seeing what the community does with PyTorch’s new linear algebra functionality!

Read More