At AWS re:Invent 2020, AWS released the profiling functionality for Amazon SageMaker Debugger. In this post, we expand on the importance of profiling deep neural network (DNN) training, review some of the common performance bottlenecks you might encounter, and demonstrate how to use the profiling feature in Debugger to detect such bottlenecks.
In the context of DNN training, performance profiling refers to the art of analyzing the manner in which your training application is utilizing your training resources. Training resources are expensive, and your goal should always be to maximize their utilization. This is particularly true of your GPUs, which are typically the most expensive system resource in deep learning training tasks. Through performance profiling, we seek to answer questions such as:
- To what degree are we utilizing our CPU, GPU, network, and memory resources? Can we increase their utilization, and if so, how?
- What is our current speed of training, as measured, for example, by the training throughput, or the number of training iterations per second? Can we increase the throughout, and if so, how?
- Are there any performance bottlenecks that are preventing us from increasing the training throughput, and if so, what are they?
- Are we using the most ideal training instance types? Might a different choice of instance type speed up our training, or be more cost-effective?
Performance analysis is an integral step of performance optimization, in which we seek to increase system utilization and increase throughput. A typical strategy for performance optimization is to iterate the following two steps until you’re satisfied with the system utilization and throughput:
- Profiling the training performance to identify bottlenecks in the pipeline and under-utilized resources
- Addressing bottlenecks to increase resource utilization
Effective profiling analysis and optimization can lead to meaningful savings in time and cost. If you’re content with 50% GPU utilization, you’re wasting your (your company’s) money. Not to mention that you could probably be delivering your product much sooner. It’s essential that you have strong tools for profiling performance, and that you incorporate performance analysis and optimization as an integral part of your team’s development cycle.
That’s where the newly announced profiling capability of Debugger comes in.
Debugger is a feature of Amazon SageMaker training that makes it easy to train machine learning (ML) models faster by capturing real-time metrics such as learning gradients and weights. This provides transparency into the training process, so you can correct anomalies such as losses, overfitting, and overtraining. Debugger provides built-in rules to easily analyze emitted data, including tensors that are critical for the success of training jobs.
With the newly introduced profiling capability, Debugger now automatically monitors system resources such as CPU, GPU, network, I/O, and memory, providing a complete resource utilization view of training jobs. You can profile your entire training job or portions thereof to emit detailed framework metrics during different phases of the training job. You can reallocate resources based on recommendations from the profiling capability. Metrics and insights are captured and monitored programmatically using the SageMaker Python SDK or visually through Amazon SageMaker Studio.
Let’s demonstrate how to use Debugger to profile the performance of a ResNet50 model. Full documentation of this example is available in the following Jupyter notebook.
Configuring a training job
To configure profiling on a SageMaker training job, we first create an instance of the ProfileConfig object, in which we specify the profiling frequency. The profiler supports a number of optional settings for controlling the level and scope of profiling, including Python profiling and DataLoader profiling. For more information about the API, see Amazon SageMaker Debugger.
The ProfileConfig instance is applied to SageMaker Estimator. In the following code, we set the system monitoring interval 500 milliseconds. We also set batch_size to 64.
from sagemaker.profiler import ProfilerConfig, FrameworkProfile


profiler_config = ProfilerConfig(
    system_monitor__interval_millis=500,
    framework_profiling_params=FrameworkProfile(start_step=5, num_steps=2)
)

estimator = TensorFlow(
    role=sagemaker.get_execution_role(),
    instance_count=1,
    instance_type='ml.p2.xlarge',
    entry_point='train_tf.py',
    source_dir='demo',
    framework_version='2.3.',
    py_version='py37',
    profiler_config=profiler_config,
    script_mode=True,
    hyperparameters={'batch_size':64}
When the training session starts, Debugger collects and uploads profiling data to a secured Amazon Simple Storage Service (Amazon S3) bucket that you own and control. This enables investigation of performance issues while the training is still ongoing. You can view the profiling data in Studio. In addition, Debugger provides APIs for loading and analyzing the data programmatically.
Throughout the training, a diagnostic report is automatically generated and periodically updated, with a summary of the profiling results of the training session and recommendations for how to improve resource utilization. You can view the report in Studio or pull it from Amazon S3 in HTML format for offline analysis. Debugger generates a notebook (profiler-report.ipynb) that you can use to adjust the profiler report as needed.
Reviewing profiling results in Studio
You can view the collected performance metrics in Studio. The Overview tab of the Debugger Insights page provides a summary report of the profiling analysis. For more information about what issues are automatically analyzed and reported, see List of Debugger Built-in Rules.
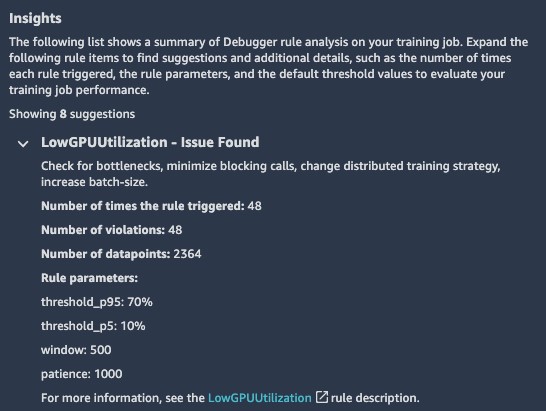
In our example, it has identified low utilization of the GPU and advises us to check for bottlenecks or increase the batch size. The low GPU utilization should raise a red flag for us. As we mentioned earlier, the GPU is typically the most expensive resource you use, and you should always strive to maximize its use.

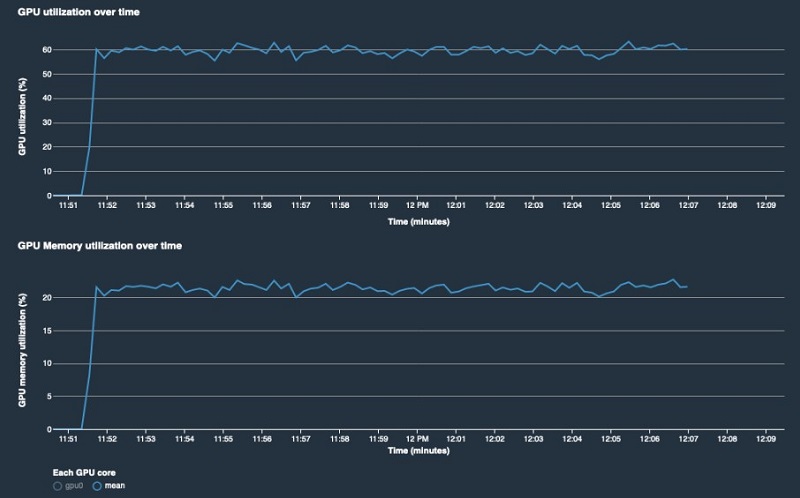
The Nodes tab includes plots of the system utilization and framework metrics. This is available as soon as the training starts, and Debugger begins to upload the collected data to Amazon S3.
The following plots show that although there are no bottlenecks in the system, both the GPU and GPU memory are highly under-utilized.

These results are clear indications that the batch size we chose is leading to under-utilization of the system resources, and that we can increase training efficiency by increasing the batch size. When we rerun the job with the batch size set to 1024, we see much better GPU utilization.
Performing advanced performance analysis using Debugger profiling
In some cases, there may be clear issues with your training, but the reasons for them might not be immediately apparent from the Studio report. In these cases, you can use the profiling analysis APIs of Debugger to deep dive into the training behavior. In the following code, we demonstrate how to load the collected system and framework metrics into a Pandas DataFrame for processing. This provides you flexibility in analyzing issues.
from smdebug.profiler.analysis.notebook_utils.training_job import TrainingJob
from smdebug.profiler.analysis.utils.profiler_data_to_pandas import PandasFrame

tj = TrainingJob(training_job_name, region)
pf = PandasFrame(tj.profiler_s3_output_path)
system_metrics_df = pf.get_all_system_metrics()
framework_metrics_df = pf.get_all_framework_metrics()
For more information about the API, see the interactive_analysis.ipynb notebook.
This section showed a simple example of how we can use the profiling functionality of Debugger to identify system resource under-utilization resulting from a small batch size. Another common cause of under-utilization is when there is a bottleneck somewhere in the training pipeline, which we address later in this post. We first highlight some of the unique features of the profiling function of Debugger.
Unique features of the Debugger profiling function
The profiler collects both system and framework metrics. Other than the inherent value in having a broad range of statistics (such as step duration, data-loading, preprocessing, and operator runtime on CPU and GPU), this enables deep learning developers or engineers to easily correlate between system resource utilization metrics and training progression, and glean deeper insights into potential issues. For example, in the following image, we use the profiling analysis APIs in Debugger to plot both GPU utilization and train step times on the same graph. This enables us to identify a clear connection between every fiftieth train step (marked in yellow) and severe dips in the GPU utilization.

Debugger collects performance metrics on the entire end-to-end training session. Other profilers often limit their activity to a limited number of training steps, and therefore run the risk of missing performance issues that occur outside the chosen window. In contrast, Debugger collects metrics and statistics on the entire training session, making it easier to catch performance issues that occur less regularly.
Debugger provides APIs for managing the information-interference tradeoff, which refers to the simple observation that the more we change the original pipeline to extract meaningful performance data, the less meaningful that data actually is. The more we increase the frequency at which we poll the system for utilization metrics, the more the activity of the actual profiling begins to overshadow the activity of the training loop, essentially deeming the captured data useless. Finding the right balance is not always so easy. A complete performance analysis strategy should include profiling at different levels of invasion in order to get as clear a picture as possible of what is going on.
In the next section, we review some of the potential bottlenecks in a typical training pipeline, and how to detect them using the profiling function of Debugger.
The training pipeline and potential bottlenecks
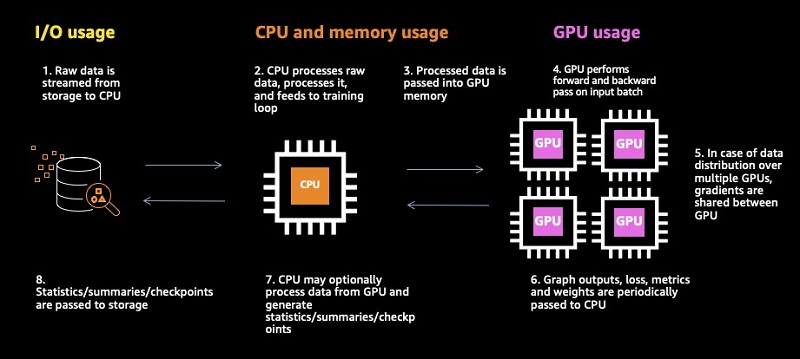
To facilitate the discussion on the possible bottlenecks within a training session, we present the following diagram of a typical training pipeline. The training is broken down into eight steps, each of which can potentially impede the training flow.

Let’s dive into a few of the potential bottlenecks and demonstrate how we can use the profiling functionality of Debugger to identify them.
Raw data input
Unless you’re auto-generating your training data, you’re likely loading it from storage. This might be from local storage such as Amazon Elastic Block Store (Amazon EBS) or local NVMe SSD disks, or it might be over the network via Amazon Elastic File System (Amazon EFS), Amazon FSx for Lustre, or Amazon S3. In either case, you’re using system resources that could potentially block the pipeline. If the amount of raw data per training sample is particularly large, if your I/O interface has high latency, or if the network bandwidth of your training instance is low, you may find your CPU sitting idly as it waits for the raw data to come in.
A classic example of this is when you train with SageMaker using File input mode. In File input mode, all the training data is downloaded to the local file systems of the training instances before the training starts. If you have a lot of data, you could be waiting a while before the first epoch starts.
The alternative SageMaker option is to use Pipe input mode. This allows you to stream data directly from an S3 bucket into your input data pipeline, thus avoiding the huge bottleneck to training startup. But even in the case of Pipe input mode, you can easily run up on resource limitations. For example, if your instance type supports network I/O of up to 10 Gbs, and each sample requires 100 Mb of raw data, you have an upper limit of 100 training samples per second, no matter how fast your GPU is. The way to overcome such issues is to reduce your raw data, compress some of the data, use a binary dataset format like TFRecord or RecordIO instead of raw data files, or choose an instance type with a higher network I/O bandwidth.
For our example, the limitation comes from the network I/O bandwidth of the instance, but it can also come from a bandwidth on the amount of data that you can pull from Amazon S3 or from somewhere else along the line. (If you’re pulling data from Amazon S3 without using Pipe mode, make sure to choose an instance type with Elastic Network Adapter enabled.)
A common footprint of a bottleneck caused by the NetworkIn bandwidth is low GPU utilization, combined with high (maximum) network utilization. The following chart shows the GPU utilization reported by the Debugger profiler and displayed in Studio. In this case, we have artificially increased the network traffic by blowing up the size of each incoming data record with 1 MB of zeros. As a result, the GPU remains mostly idle, while it waits for the training samples to come in.

Data preprocessing
The next step in the training pipeline is the data preprocessing. In this stage, typically performed on the CPU, the raw data is prepared for entry to the training loop. This might include applying augmentations to input data, inserting masking elements, batching, filtering, and more. In the case of TensorFlow, tf.data functions include built-in functionality for parallelizing the processing operations within the CPU (for example, the num_parallel_calls argument in the tf.data.dataset.map routine), and also for running the CPU in parallel with the GPU (for example, tf.data.dataset.prefetch). Similarly, the PyTorch APIs allow for multi-process data loading and automatic memory pinning. However, if you’re running heavy or memory-intensive computation in this stage, you might still find yourself with your GPU idle as it waits for data input.
For more information about how to use Debugger to identify a bottleneck in the data input pipeline, see the dataset_bottleneck.ipynb notebook.
A common footprint of this bottleneck is low GPU utilization, along with high CPU utilization (see the following visualizations).

Model output processing
The CPU might perform some processing on the output data received from the GPU. In TensorFlow, this processing often occurs within TensorFlow callbacks. You can use these to evaluate tensors, create image summaries, collect statistics, update the learning rate, and more. There are different ways in which this could reduce the training throughput:
- If the processing is computation or memory intensive, this may become a performance bottleneck. If the processing is independent of the model GPU state, you might want to try running in a separate (non-blocking) thread.
- If your callbacks are processing output on frequent iterations, you’re also likely slowing down the throughput. Consider reducing the frequency of the processing or adding the processing to the GPU model graph.
For more information about how to use Debugger to identify a bottleneck from a training callback, see the callback_bottleneck.ipynb notebook.
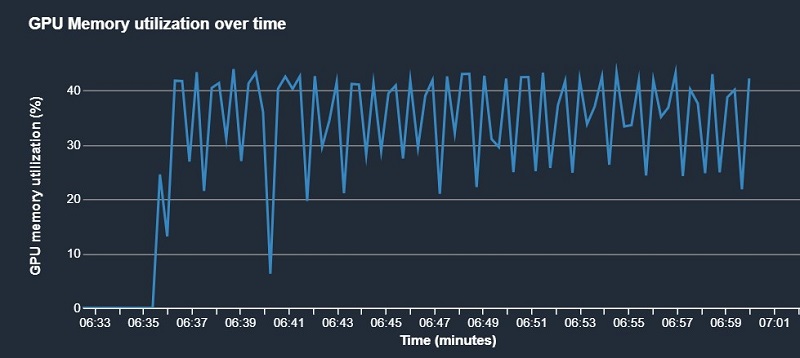
A common footprint of this bottleneck are periodic dips in GPU utilization, which can be correlated with heavy callback activity (see the following visualization).

Conclusion
The newly announced profiling functionality of SageMaker Debugger offers essential tools for identifying training bottlenecks and under-utilization of system resources. You can use these tools to increase your training efficiency and reduce training costs. In this post, we demonstrated a few simple use cases. The configuration APIs include controls for a wide variety of low-level profiling features, which provide coverage for a broad range of potential issues. For more information, see the Debugger profiling examples in the GitHub repo.
For additional resources about TensorFlow, and deep learning performance tips on PyTorch or Apache MXNet, see the following:
- TensorFlow Performance Analysis
- Deep Learning Computation: GPUs
- Choosing the right GPU for deep learning on AWS
About the Authors
 Muhyun Kim is a data scientist at Amazon Machine Learning Solutions Lab. He solves customer’s various business problems by applying machine learning and deep learning, and also helps them gets skilled.
 Chaim Rand is a Machine Learning Algorithm Developer working on Autonomous Vehicle technologies at Mobileye, an Intel Company.
